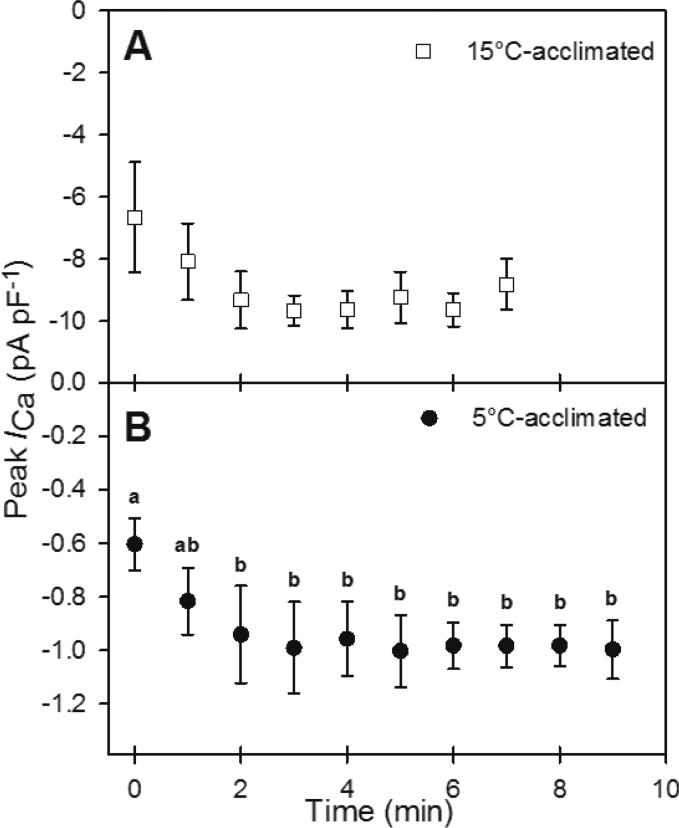
Fig. 2.
Time-dependent changes in the peak amplitude of ICa of (A) 15°C- and (B) 5°C-acclimated Alaska blackfish ventricular cardiomyocytes. Values are means ± S.E.M. Dissimilar letters indicate a statistically significant difference (P<0.05) between time points (repeated measures ANOVA with Student-Newman-Keuls post hoc analysis). N=4 cells from 3 fish at 15°C, N=5 cells from 5 fish at 5°C.

