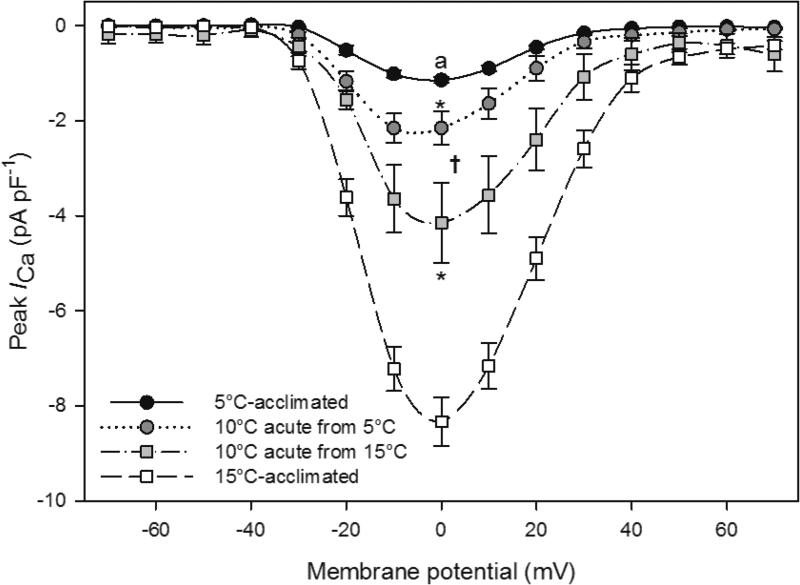
Fig. 4.
Mean current-voltage relationship for Alaska blackfish ventricular cardiomyocytes recorded at acclimation temperature (15°C or 5°C) and then acutely exposed to and recorded at 10°C. Values are means ± S.E.M. Dissimilar letters indicate a significant difference (P<0.05) between 15°C- and 5°C-acclimated cells at 0 mV (unpaired t-tests). An asterisk (*) indicates a statistically significant effect of acute exposure to 10°C from an acclimation temperature (P<0.05) at 0 mV (paired t-tests). A dagger (†) indicates a significant difference (P<0.05) at 0 mV between 15°C- and 5°C-acclimated cells acutely exposed and recorded at 10°C (unpaired t-tests). N=13 cells from 9 fish at 5°C, N=7 cells from 5 fish at 10°C (from 5°C), N=6 cells from 3 fish at 10°C (from 15°C), and N=10 cells from 6 fish at 15°C.

