
FIGURE 6.
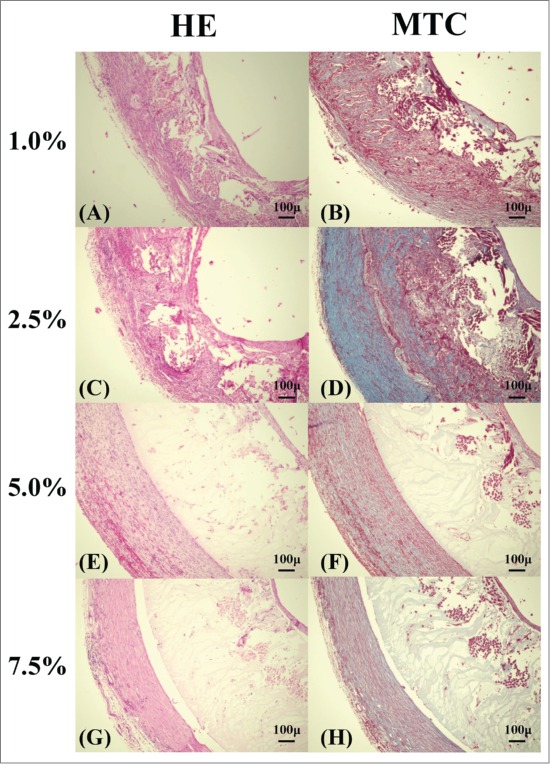
Histological micrographs of the removed grafts: Hematoxylin and eosin (HE) staining [1.0% (A), 2.5% (C), 5.0% (E), 7.5% (G)], Masson trichrome (MTC) staining [1.0% (B), 2.5% (D), 5.0% (F), 7.5% (H)] of grafts removed 3 weeks after implant.
Official websites use .gov
A
.gov website belongs to an official
government organization in the United States.
Secure .gov websites use HTTPS
A lock (
) or https:// means you've safely
connected to the .gov website. Share sensitive
information only on official, secure websites.
Histological micrographs of the removed grafts: Hematoxylin and eosin (HE) staining [1.0% (A), 2.5% (C), 5.0% (E), 7.5% (G)], Masson trichrome (MTC) staining [1.0% (B), 2.5% (D), 5.0% (F), 7.5% (H)] of grafts removed 3 weeks after implant.