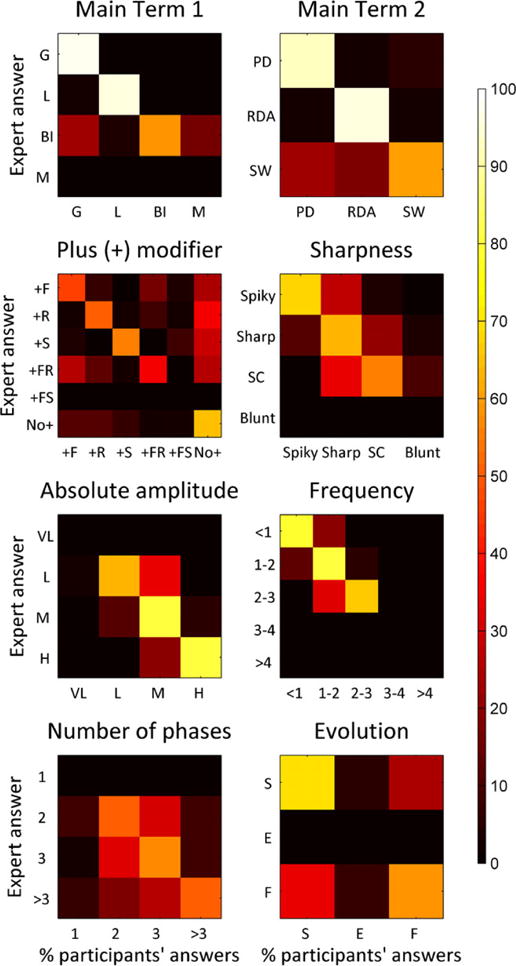
Figure 3.

Confusion matrices. Color-coded confusion matrices for 10 ACNS standardized critical care EEG terminology items are displayed as heat map (scale bar on the right). The available choices for each concept are shown along the vertical and horizontal axes. Heat map intensities indicate the percentage of respondents who chose each option along the horizontal axis when the correct response (determined by panel-of-experts consensus) was the one on the vertical axis. The percentage of respondents choosing each available option is displayed on a color scale along the horizontal (column) axes. A perfect result would produce a diagonal white line from upper left to lower right, with all squares not on or adjacent to that line being black. The majority of respondents selected the correct term on average in all cases shown. It is notable that the minority of incorrect responses was generally “close” to the correct response (near the diagonal line). Abbreviations are as in Figure 1.
Epilepsia © ILAE
