Figure 2.
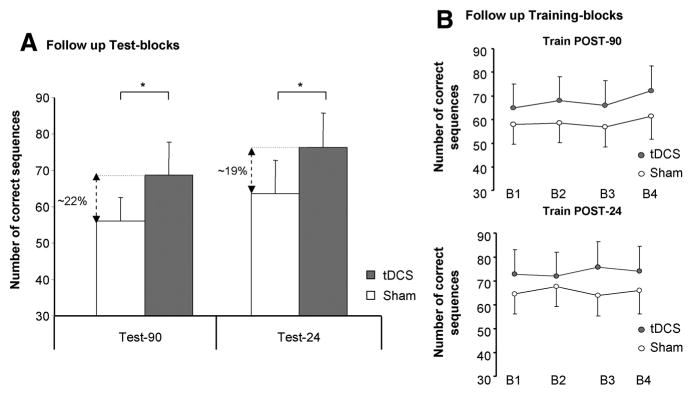
Follow-up sessions. A, The bar graph shows the number of correct sequences evaluated at Test-90 and Test-24; the percentages of improvement for tDCS compared with sham stimulation are included in the graph for both test blocks (*Scheffé post hoc P<0.05). B, Practice sessions performed at Post-90 minutes and Post-24 (late online learning) hours did not show further behavioral improvement (error bars=SEM). tDCS indicates transcranial direct current stimulation.

