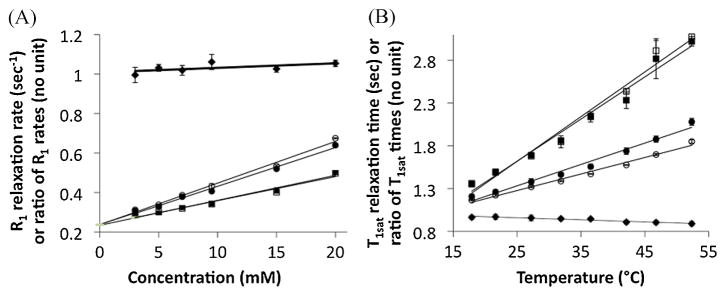
Figure 5.
The T1 relaxation properties of Yb-DO3A-oAA. Results are shown with respect to (A) concentration and (B) temperature for selective saturation of the amide (solid circles) and amine (open circles), and for control studies with no saturation (solid squares) and selective saturation at +80 ppm (open squares). These linear relationships have an r2 correlation coefficient > 0.98. The amine-to-amide ratio is also shown (solid diamonds). Error bars represent the standard deviation of the T1 inversion-recovery data fitting routine, and are smaller than the symbol for many data points. The concentration-dependent ratio of R1sat relaxation rates is relatively constant compared with the rates of the amine or amide.

