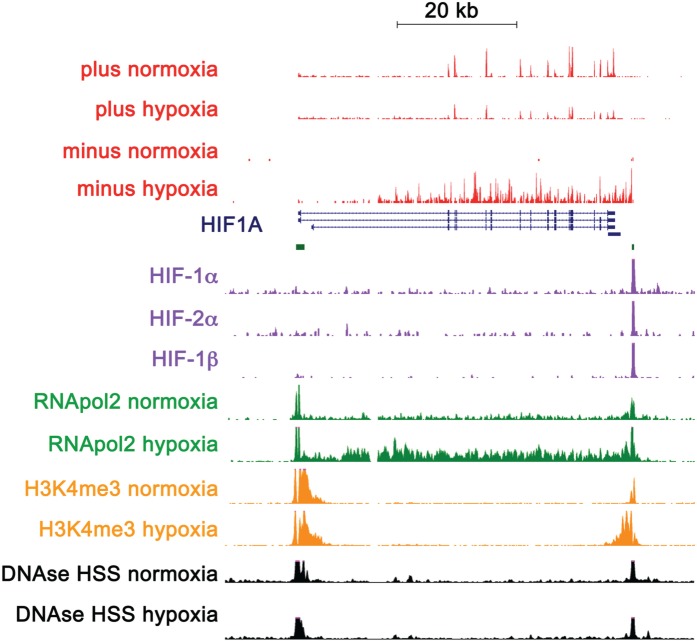
Figure 2.
HIF-1A antisense transcript. Tracks for positive and negative strand RNA-seq in normoxia and hypoxia are shown in red. The positive strand HIF-1α mRNA is reduced in hypoxia, while the antisense HIF-1α is induced by hypoxia. Refseq genes are shown in navy with CpG islands identified at each end of the gene. HIF ChIP-seq tracks are shown in purple and show strong binding close to the TSS of the antisense transcript. RNApol2 ChIP-seq tracks, in green, show RNApol2 peaks at each end of the gene, with an increase in the right-hand peak together with increased RNApol2 across the body of the gene in hypoxia. H3K4me3 ChIP-seq tracks, in orange, show peaks of the promoter-associated mark at both ends of the HIF1A gene, with an increase in the right-hand peak in hypoxia. DNAse hypersensitivity tracks, in black, show peaks at both ends of the HIF1A gene. (A colour version of this figure is available online at: http://bfg.oxfordjournals.org)

