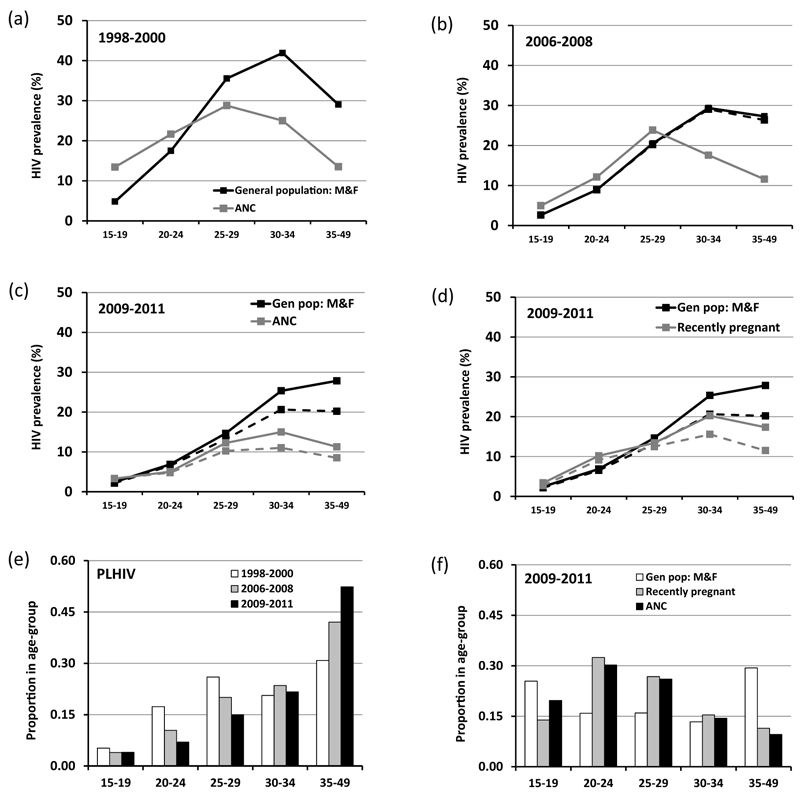
Figure 2. Changes in the age-pattern of HIV prevalence over time and differences between the age-distributions of pregnant women attending local ANCs and the general population (aged 15-49 years), Manicaland, Zimbabwe, 1998 to 2011.
Age-specific HIV prevalence rates in local ANC attendees and males and females in the general population in 1998-2000 (graph (a)), 2006-2008 (b) and 2009-2011 (c). Age-specific HIV prevalence rates in local ANC attendees and locally-resident pregnant women in 2009-2011 (d). Dashed lines in graphs (b)-(d) show HIV prevalence in people not on anti-retroviral therapy (before the pregnancy for ANC attendees). Changes over time in the age-distribution of HIV-positive adults in the general population (e); and comparison of the age-distributions of local ANC attendees and all adults and locally-resident pregnant women in the general population, 2009-2011 (f).

