Figure 6.
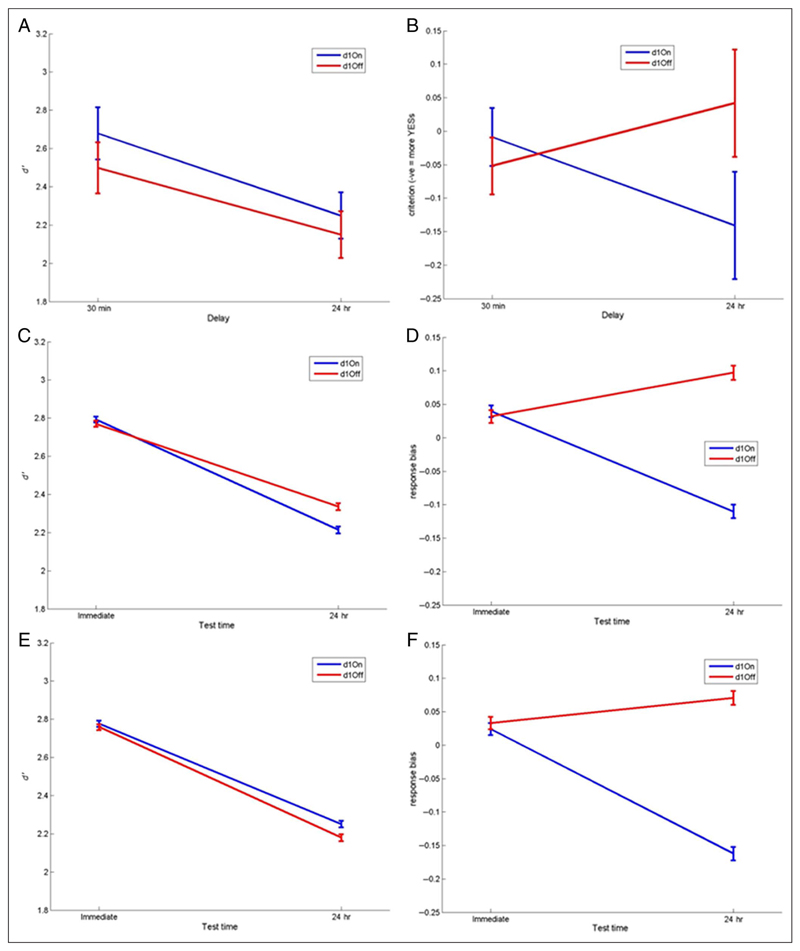
The behavioral and simulated d′ and response bias results for the patients and decay and threshold models. The results of the model fittings; (A) Behavioral d′ and (B) response bias data for PD patients split by Day 1 medications state (Day 1 on vs. Day 1 off). (C) The simulated d′ for the best fitting decay model (blue lines are simulated PD Day 1 on medication patients, and red lines are Day 1 off medication). (D) The simulated response biases for the best fitting decay model (RMSD = 0.0778), showing the same pattern as the behavioral data. The best fitting parameters were as follows: Day 1 on: α+ = .1515, α− = 0.8787; Day 1 off: α+ = 0.4079, α− = 0.8702. (E) The simulated d′ for the best fitting threshold model (RMSD = 0.0620) and (D) the simulated response bias results. The best fitting parameters were as follows: α+ = 0.3685, α− = 0.7562, Day 1 on: T2 = 1.1594; Day 1 off: T2 = 1.1108. The threshold model has a better fit to the data, based on the lower RMSD, which may be due to Day 1 on d′ being slightly higher than Day 1 off, as in the behavioral data.

