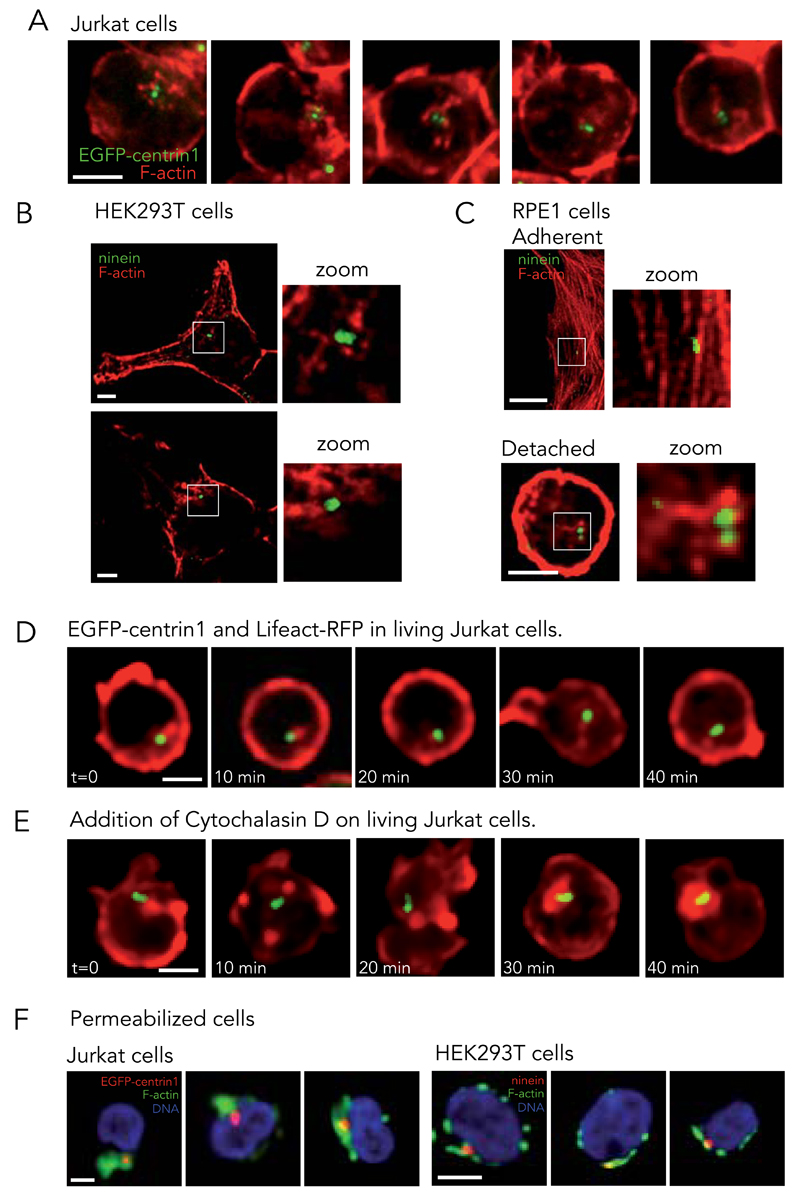
Figure 2. Association of actin filaments with centrosome in living cells.
(A) Actin filaments staining with phalloidin (red) in Jurkat cells expressing EGFP-centrin1 (green). Images are representative of 4 independent experiments. (B) F-actin (phalloidin, red) and ninein (green) in HEK293T cells. Images are representative of 2 independent experiments. (C) F-actin (phalloidin, red) and ninein (green) in RPE1 cells, adherent and in solution. Images are representative of 2 independent experiments. Cells were fixed with PFA. (D) Time-series of Jurkat cells expressing EGFP-centrin1 (green) transfected with Lifeact-RFP to visualize actin network (red). Image gamma was set to 0.65 to highlight the cytoplasmic network. Images are representative of 6 independent experiments. (E) Same as (D) except after the addition of 10 μg/ml cytochalasin D at t=0. Images are representative of 3 independent experiments. (F) DNA (blue) and F-actin (phalloidin, green) in pre-permeabilized and fixed Jurkat cells (left panel) expressing EGFP-centrin1 (red) and HEK293T cells (right panel) stained for ninein (red). Images are representative of 5 and 2 independent experiments for Jurkat and HEK293T cells respectively. Scale bars: 5 μm.

