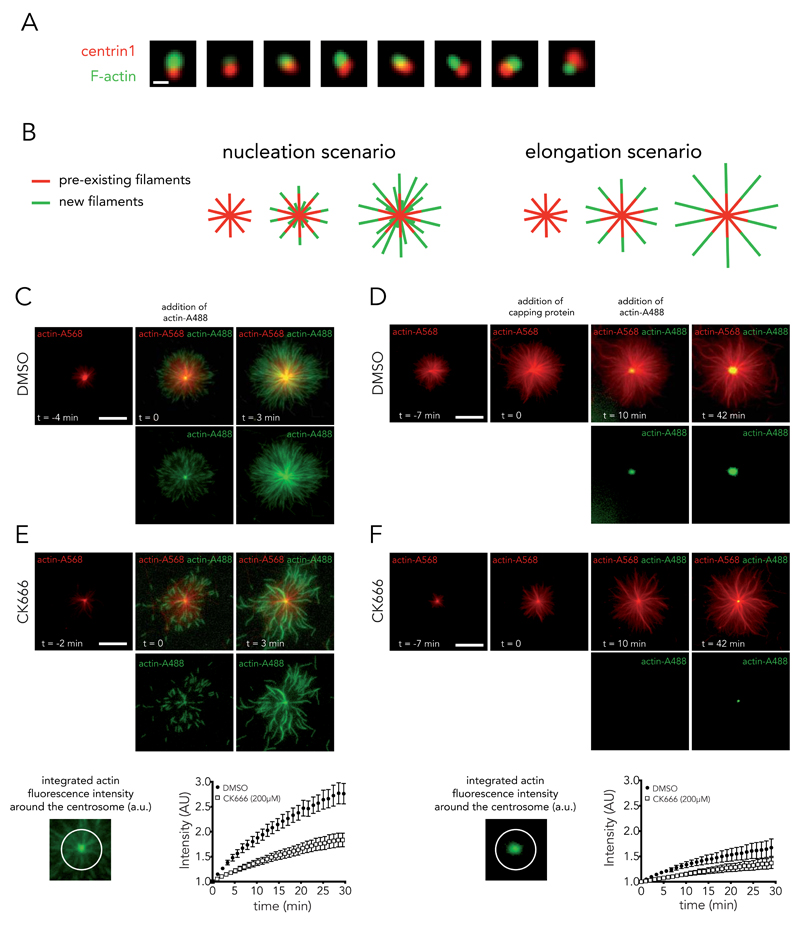
Figure 3. Isolated centrosomes nucleate actin filaments.
(A) Actin-filament staining with phalloidin (green) on isolated centrosomes (EGFP-centrin1 in red). Images are representative of 4 independent experiments. Scale bar: 2 μm. (B) Schematic representations of actin-filament nucleation and elongation hypotheses. (C, E) Time-lapse imaging of actin-filament assembly from isolated centrosomes in the presence of Alexa568-actin monomers (red) followed by addition of Alexa488-actin monomers (green). Bottom row shows green channel and top row the overlay. Growth of green actin filaments at the centrosome supported the nucleation hypothesis. Actin nucleation activity was measured at the centrosome in the presence of DMSO (full circles, mean of n = 9 actin asters) or 0.2 mM of CK666 (empty squares, mean of n = 17 actin asters); data show the results of a single experiment, representative of 2 independent experiments. Bars represent the s.d. (D, F) Same as (C, E) except that capping protein is added 10 minutes prior to Alexa488-actin monomers to block red actin filaments. Here also, growth of green actin filaments at the centrosome supported the nucleation hypothesis. DMSO and CK666 mean of n = 15 and 21 actin asters respectively; data show the results of a single experiment, representative of 3 independent experiments. Bars represent s.d. With or without the capping of older actin filaments, Arp2/3 inhibition reduced actin nucleation at the centrosome. Scale bars:10 μm.

