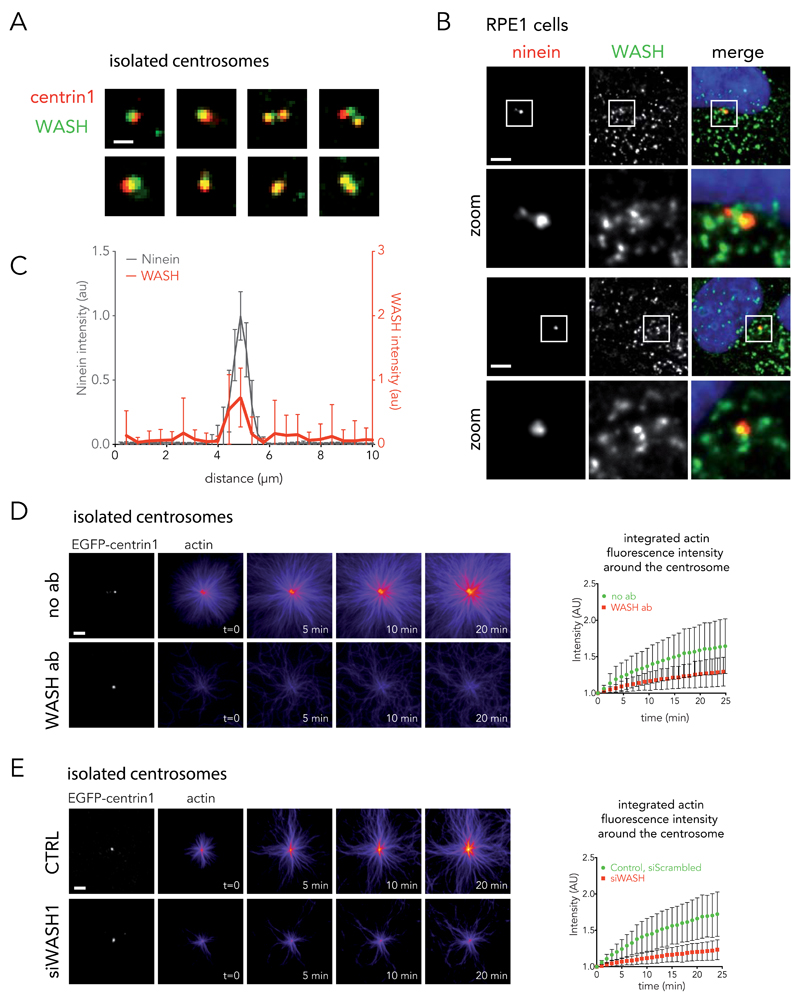
Figure 6. Implication of the WASH complex in actin nucleation at the centrosome.
(A) Immunostaining of WASH (green) on isolated centrosomes (EGFP-centrin1 in red). Images are representative of 2 independent experiments. Scale bar: 2 μm. (B) RPE1 cells were fixed in cold methanol and stained for ninein (left panel) and WASH (central panel). Right panel shows the overlay of WASH (green), ninein (red) and DNA (blue). Images are representative of 3 independent experiments. Scale bar: 5 μm. (C) Linescan analysis of fluorescent distribution of WASH (red line) at the centrosome (ninein, black line) (mean of n = 31 cells, data are pooled from 2 independent experiments). Bars represent the s.d. (D) Inhibition of WASH on isolated centrosomes with blocking antibodies (bottom row). Control experiments performed without antibody (no ab, top row). Data show the results of a single experiment, representative of 2 independent experiments: n = 25 and 27 actin asters for no antibody (green discs) and WASH antibody (red squares) respectively (mean ± s.d.). Scale bar: 5 μm. (E) Actin nucleation activity of centrosomes isolated from siWASH1-treated cells (bottom row) or control cells (top row). Data show the results of a single experiment, representative of 2 independent experiments: n = 20 and 26 actin asters for control (green discs) and siWASH1 (red squares) condition respectively (mean ± s.d.). Scale bar: 5 μm.

