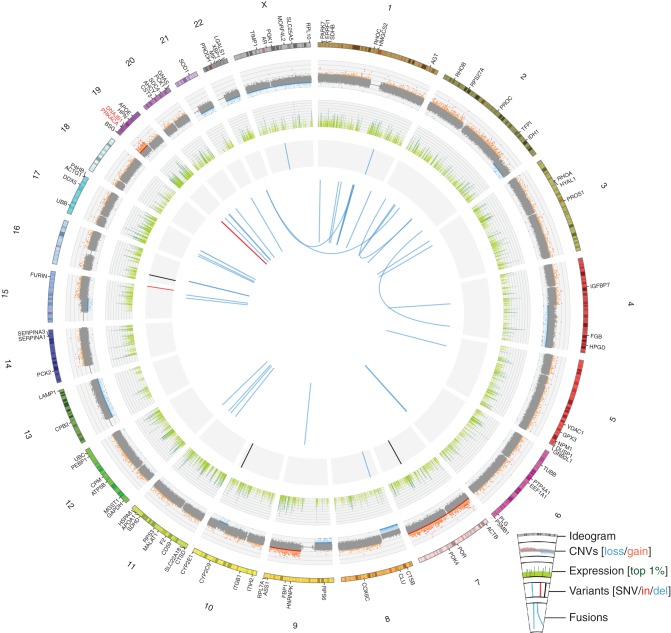
Figure 3.
A Circos plot displays genomic and transcriptomic alterations observed in the BrainMet1.1 sample from the index case of mixed fibrolamellar HCC. For the outermost ring, a chromosome ideogram is shown with selected genes labeled. The first data track displays copy number variants (CNVs) from genotype array data with tumor-normal logR ratios plotted and segments called by cnv-hmm (unpublished software). Copy-altered segments are indicated as dark red (gain) or dark blue (loss). The next data track plots RNA-seq gene-level fragments per kilobase of transcript per million mapped reads (FPKM) values on a log2 scale in light green with the top 1% most highly expressed genes indicated in dark green. Next, single-nucleotide variants (black), small insertions (red), and small deletions (blue) from exome data are indicated. These include two somatic and five ambiguous variants (supplementary Results, available at Annals of Oncology online). Finally, the centermost ring plots RNA-seq fusions (ChimeraScan) in light blue with the intrachromosomal fusion between DNAJB1 and PRKACA highlighted in red.

