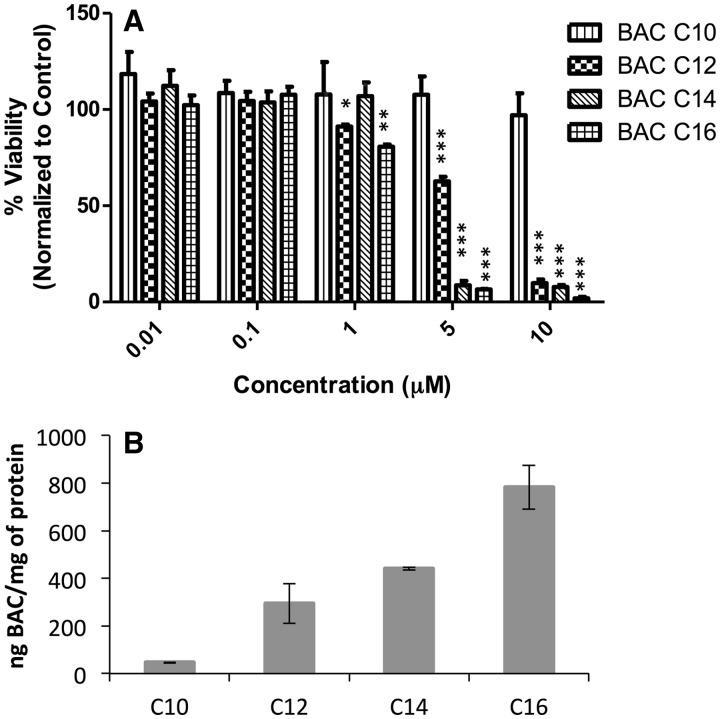
FIG. 2.
(A) Cytotoxicity of individual BACs on Neuro2a cells after 48 h of treatment. (B) Incorporation levels of individual BACs in Neuro2a cells after 48 h of treatment of each compound at 100 nM. BACs were analyzed by UPLC-MS/MS as described in Materials and Methods. *, P < .05; **, P < .005; ***, P < .0005; n = 3; all statistical analyses are relative to Control using Student’s t-test.

