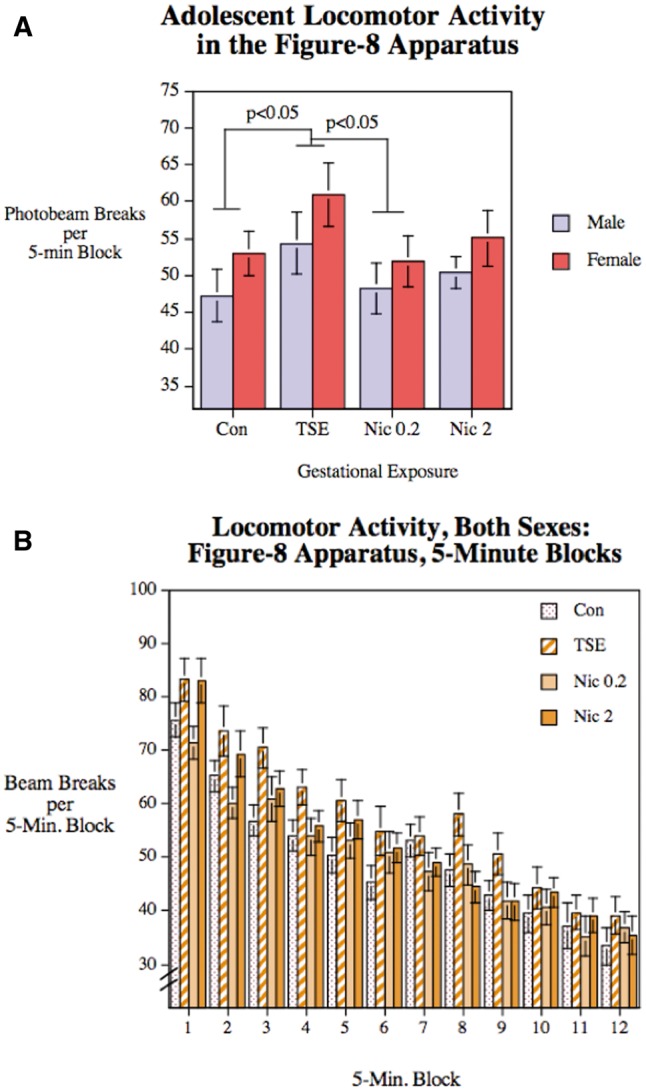
FIG. 2.

Figure-8 maze performance in Con, animals exposed to TSE, or animals exposed to Nic at 0.2 or 2 mg/kg/d. Data represent means and SEs obtained from 12 to 14 animals for each sex and treatment. A, Average performance over the 60-min test period. B, Performance in each 5-min block. ANOVA indicates significant main effects of treatment (P < .05), sex (P < .05), and block (P < .0005), but no interactions of treatment with the other 2 variables.
