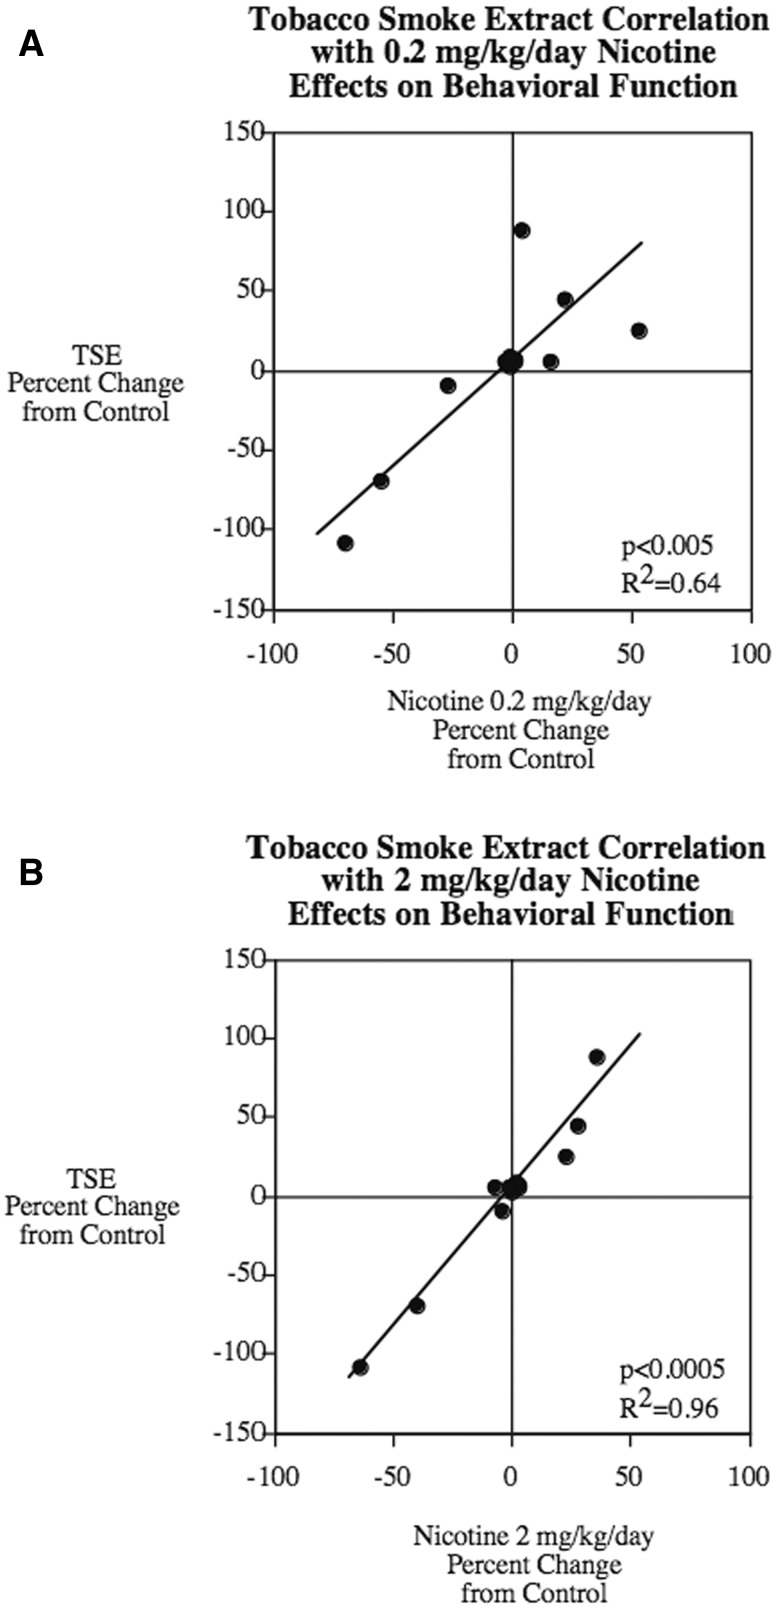
FIG. 7.
Concordance plots demonstrating the dependence of TSE behavioral effects on Nic. A, 0.2 mg/kg/d. B, 2 mg/kg/d. Data were taken from Figures 1–6 and converted to percent change from control to enable all tests to contribute equally. For the elevated plus maze, we used only the data in Figure 1A so as not to inflate the contribution of this test. Likewise, for working memory, we used the data from only one set of blocks (the last set, reflecting persistent effects on working memory). Each test contributed 2 points to the regression plot, one for males and one for females.

