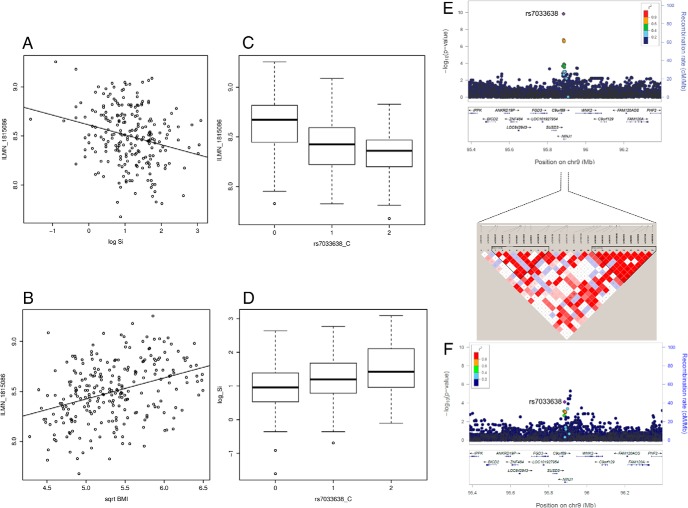
Figure 2.
Ninjurin1 (NINJ1) transcript is associated with SI and cis-eSNPs for this transcript also associate with SI in AAs. The scatter plot shows association of NINJ1 transcript expression (ILMN_1815086) in adipose tissue with SI and BMI (A, B). The box plot shows association of NINJ1 transcript expression (ILMN_1815086) in adipose with genotype of the cis-eSNP rs7033638 (C) and association of SI and with genotype of the SNP rs7033638 (D). LocusZoom plots show regional association of NINJ1 cis-eQTL region SNPs (genotyped and imputed) with transcript expression and SI (E, F). Significance level (-log10 P-values) indicated in LocusZoom plots are based on score test implemented in the program SNPTEST. LD plot shows LD relationship (r2) between genotyped SNPs in the marked region.

