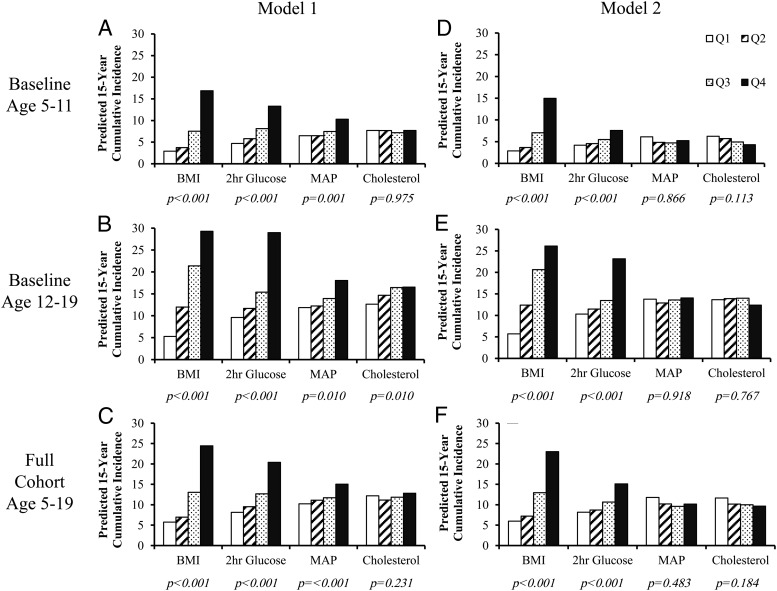
Figure 2.
Predicted cumulative incidence of diabetes by quartile rank of risk factor. A–C, Model 1 is adjusted for follow-up age, sex, and the interaction between age and the risk factor of interest. D–F, Model 2 is further adjusted for the other risk factors and their age-interactions. P values are given for the linear trend.

