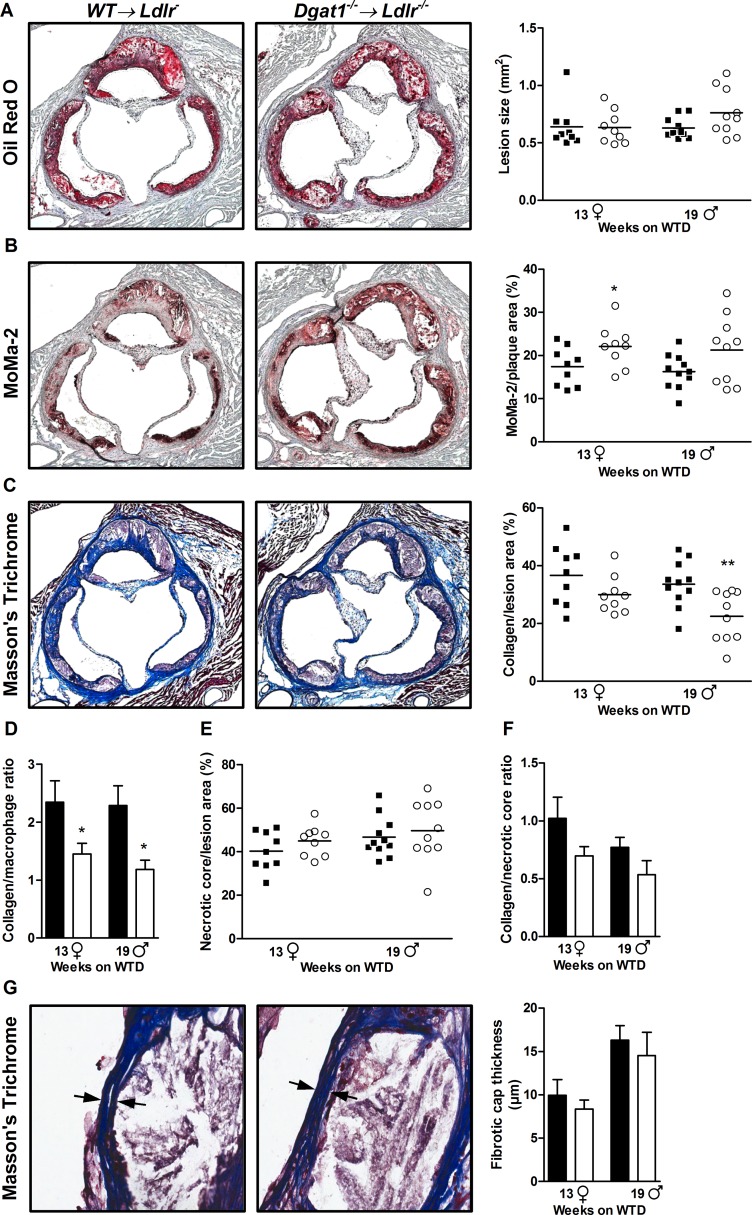
Fig 4. Increased plaque inflammation in Dgat1–/–→ Ldlr–/–mice.
(A-C, left) Representative images of aortic root sections stained with ORO, MoMa-2, and Masson's Trichrome. (A-C, right) Quantification of these images to measure plaque size, macrophage content, and collagen deposition, respectively. (D-F) Integrated quantification of data from A-C to determine collagen-to-macrophage ratios, necrotic core per plaque area, and collagen-to-necrotic core ratios, respectively. (G) Representative images of Masson’s Trichrome-stained aortic root sections focused on plaque fibrotic caps, with quantification of minimal fibrotic cap thickness. All data represent means ± SEM of 12 aortic root sections for ORO and three aortic root sections in the area of maximal plaque size for MoMa-2- and Trichrome-staining per mouse after 13 (n = 9 females, ♀) and 19 weeks (n = 10–11 males, ♂) of WTD feeding. *, p < 0.05.

