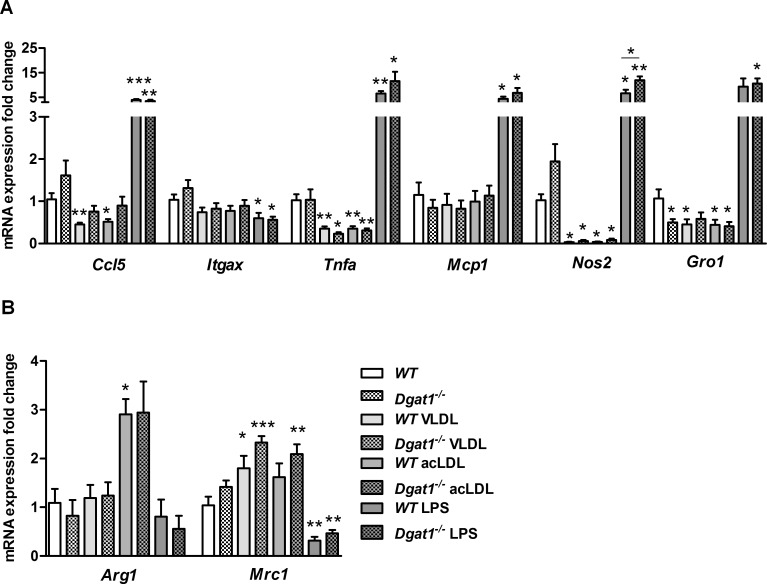
Fig 5. M1 and M2 gene expression in lipoprotein-treated WT and Dgat1–/–macrophages.
qPCR analysis of control macrophages vs. those treated with 100 μg/ml VLDL, 100 μg/ml acLDL or 100 ng/ml LPS (positive control for M1 activation). Shown are mRNA levels of (A) M1 marker and (B) M2 marker genes analyzed in duplicate. Data are means (n = 3–6) ± SEM. *, p < 0.05; **, p ≤ 0.01; ***, p ≤ 0.001.

