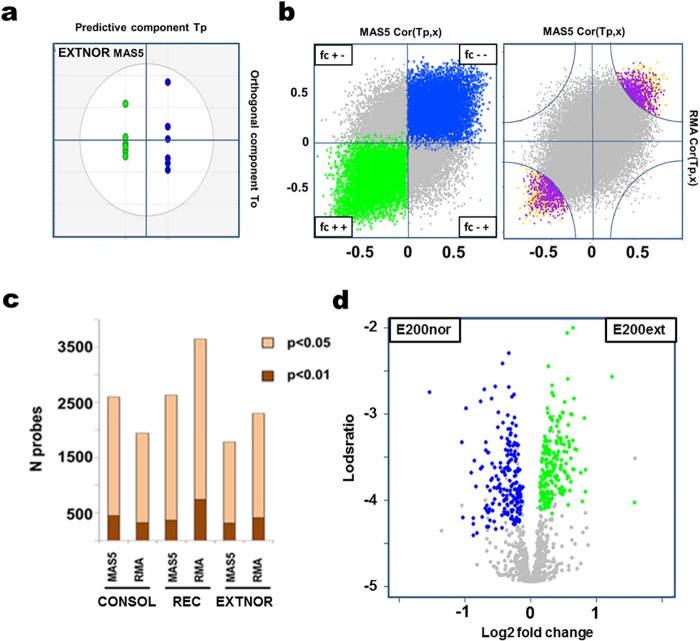
Fig 3. Genes identified with the extinction EXTNOR Affymetrix microarray dataset as being differentially regulated by both MAS5 and RMA normalization procedures.
a) OPLS-DA separation of the MAS5 normalized EXTNOR data along the predictive component (TP, between-group variation) and the first orthogonal component (T0, within-group separation). EXT group: green colour, NOR group: blue colour. b) Scatter plots of MAS5 (x-axis) and RMA (y-axis) derived OPLS-DA loadings for each EXTNOR probe scaled as correlation coefficients Cor(TP, x) between -1 and 1 for the predictive component in each model. Probes in the upper right and lower left quadrants exhibit the same fold change trends, with the blue probes (left scatterplot, fc—) being down regulated and the green probes (left scatterplot fc ++) more highly expressed in in the extinction (EXT) animals. Probes (n = 969, E969) at the tips of the cloud (right scatterplot) were selected (yellow dots) when being within a radius of r = 0.75 using the outer edges as the origo and a shared VIP > 1.0, lower confidence level > 0.0 (purple dots). c) Bar plot showing the number of probes in each full dataset according to normalization and non-adjusted moderated t-test p < 0.05 and p < 0.01. d) Volcano plot of log2 fold change against lodsratio for of MAS5 normalized E969 candidate set with the top ranked 200 probes more highly expressed shown for each experimental group (E200ext–green, E200nor–blue).

