
Fig 5. Differential gene regulation profiles in CA1 associated with the consolidation, recall and extinction of CFM.
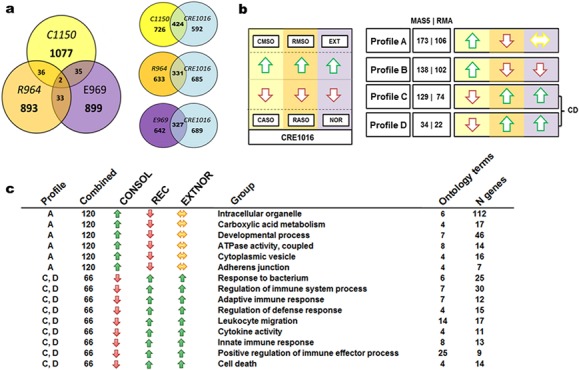
a) Venn diagram for overlap between OPLS-DA derived candidate datasets (C1150, R964, and E969). A total of 1016 probes (CRE1016) are part of at least one candidate set while having a normalization independent up- and down regulation behaviour within the separate experiments. b) k-means clustering of MAS5 and RMA log2 fold change profiles for the CRE1016 probes found four clusters (A, B, C, D) to be similar between normalizations in their silhouettes and gene content (number of genes shown in brackets as MAS5 | RMA). Coloured arrows show in which experimental group the cluster genes are more highly expressed (CASO, RASO, NOR: red arrow; CMSO, RMSO, EXT: green arrow). The fold change for the EXT vs. NOR comparison was very weak (log2 fold change |< 0.10|) in both MAS5 and RMA data and was classified as being unchanged (yellow horizontal arrow). c) The table shows the groups of significantly enriched ontology clusters (EASE < 0.01, kappa 0.7) present in the different fold change profiles (cluster A with 120 genes & fused clusters C and D with 66 genes) with the number of ontology terms and genes they encompass. Cluster B did not result in any significantly enriched ontology clusters. The ontology enrichment analysis is based on annotations provided by Gene ontologies (GOBP, GOCC, and GOMF) and Panther ontologies (Biological process, Molecular function).