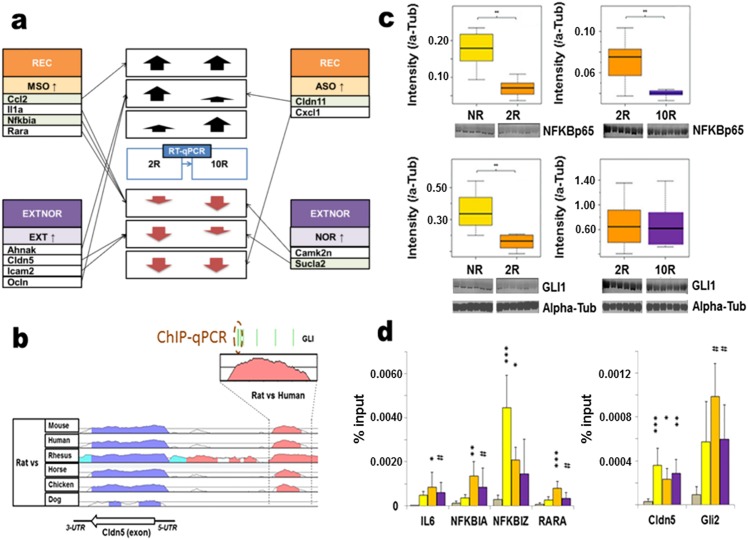
Fig 6. Validation of gene expression and promoter analysis associated with recall and extinction.
a) RT-qPCR results for a set of REC and EXTNOR dataset candidates. All genes with p-values p < 0.15 (Dunnett’s test, REC and EXTNOR groups against No recall group) are shown (light green coloured genes have a 0.10 < p < 0.15). b) Comparative genomics overview of the predicted GLI1 binding site investigated by ChIP-qPCR shows the Cldn5 gene in the Rat genome as compared to the genomes of Mouse, Human, Rhesus macaque, Horse, Chicken and Dog and where colour signifies >80% sequence similarity. Green stripes show the different conserved sites of predicted GLI1 binding between Rat and Human. c) Comparison Gli1 and RelA (NF-κBp65) protein levels in CA1 between No recall (yellow boxes, n = 6) and 2min recall (orange boxes, n = 6) and 2min recall and 10min recall (purple boxes, n = 6) using background and alpha-tubulin intensity for normalization. Pair-wise comparison of expression differences within gel runs was conducted by Welsh’s t-test. Data are represented as box-and-whisker plots of the median and interquartile ranges. d) Left panel; ChIP-qPCR of predicted binding sites for NF-κBp65 against promoter elements upstream of Il6 (overlapping with the first exon), Nfkbia (overlapping with the first exon), Nfkbiz (overlapping with the first exon), Rara (2200 bases upstream of the first aligned mouse exon). Right panel; ChIP-qPCR of predicted binding sites for GLI1 against promoter elements for Cldn5 (720 upstream of the first exon) and Gli2 (300 bases upstream of the first exon) respectively. Dunnett’s test based significance in enrichment of No recall (yellow bar, n = 6), 2min recall (orange bar, n = 6) and 10min recall (purple bar, n = 6) against negative control (IgG, tanned bar, n = 6) is shown. Data are shown as Mean +/- SD. *** p < 0.001, ** p < 0.01, * p < 0.05, # p < 0.10.

