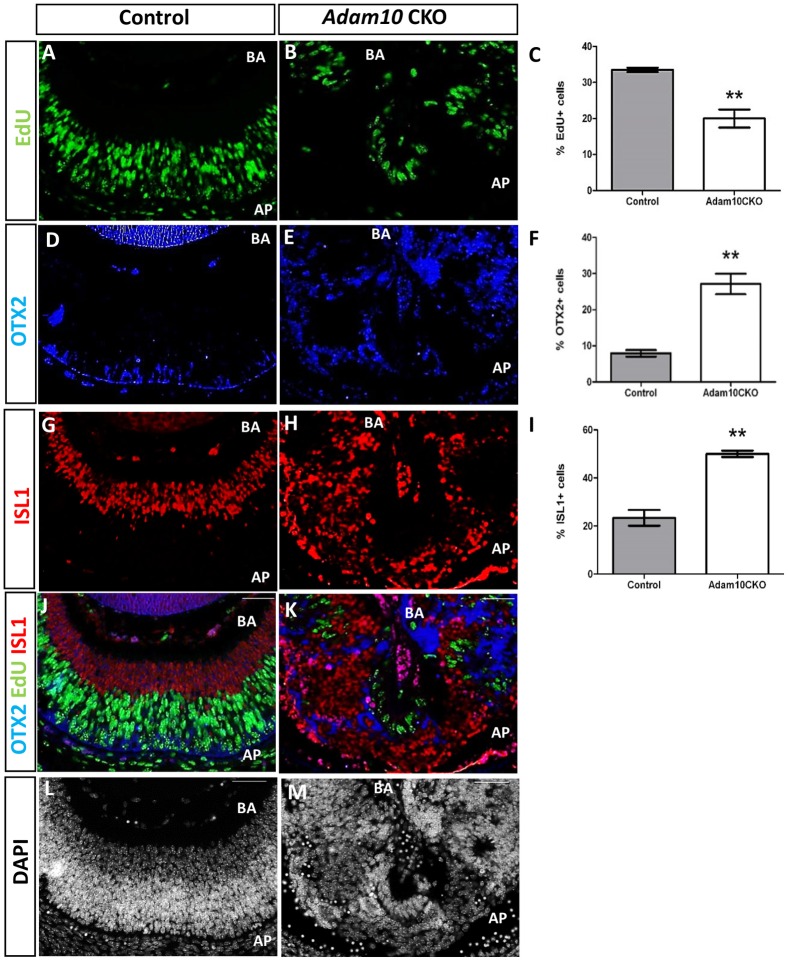
Fig 4. Retinal neurogenesis at E13.5 in control and Adam10 CKO mice.
In the control retinae (A) the EdU-positive cells were highly organized along the apical surface with no EdU-positive cells present at the basal surface. By contrast, in the Adam10 CKO eyes (B) within the central retinae a few highly disorganized EdU-positive cells were identified. Quantification analysis (C) revealed in control retinae 33.50 ± 0.61% (gray bar) and in Adam10 CKO retinae 20.01± 2.5% (white bar) EdU-positive cells indicating a significantly lower (**P = 0.019; n = 3) percentage of EdU-positive cells in the Adam10 CKO retinae. In the control retinae (D), sparse OTX2-positive immunostaining was identified in cells along the apical surface. In Adam10 CKO retinae (E), OTX2-positive cells were present in all retinal layers. Quantification analysis (F) revealed in control retinae 7.95 ± 0.9% (gray bar) and in Adam10 CKO retinae 27.1 ± 2.8% (white bar) OTX2- positive cells indicating a significantly greater (**P = 0.003; n = 3) percentage of OTX2-positive cells in Adam10 CKO retinae. In the control retinae (G), ISL1-positive cells were identified within the basal layer whereas in Adam10 CKO retinae (H) ISL1-positive cells were highly disorganized and present in all retinal layers. Quantification analysis (I) revealed in the control retinae 23.4 ± 3.2% (gray bar) and in Adam10 CKO retinae 50.1 ± 1.3% (white bar) ISL1-positive cells indicating a significantly greater (**P = 0.004; n = 3) percentage of ISL1-positive cells in the Adam10 CKO retinae. In both the control (J) and Adam10 CKO retinae (K), the OTX2-positive and ISL1-positive cells did not co-stain for EdU. DAPI staining of the control and Adam10 CKO retinae are shown in (L) and (M) respectively. Bars in (C), (F), and (I) represent mean values ± SEM. AP = apical surface. BA = basal surface. Scale bar = 50 μm.

