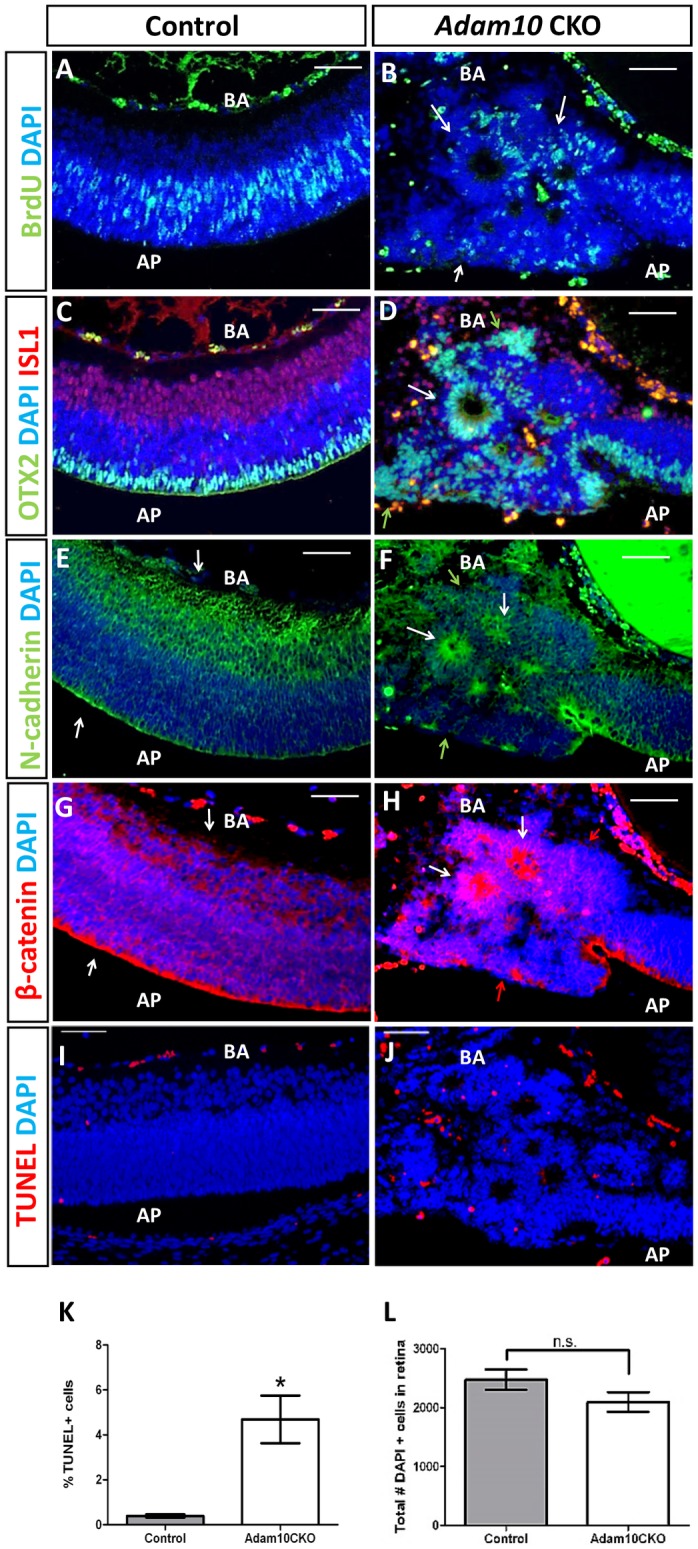
Fig 5. Characterization of rosettes in E16.5 Adam10 CKO retinae.

In controls (A) BrdU-positive cells were identified in the neuroblastic layer. In Adam10 CKO retinae, BrdU-positive cells were identified in the outer cell layer of rosettes (B, arrows). In controls (C) immunostaining for OTX2 (green) and ISL1 (red) marked early photoreceptor cells at the apical surface and ganglion cells at the basal surface. In Adam10 CKO retinae (D) the OTX2-positive cells (D, green) formed rosette lumens (D, white arrow), although OTX2-positive cells were also present at the apical and basal surfaces (green arrows in D). ISL1-positive cells (D, red) did not associate with rosettes and were scattered through the entire retina. In control retinae, N-cadherin (E) and β-catenin (G) were expressed in all retinal cells although the highest expression was in the cells forming the apical surface (white arrows in E and G). In Adam10 CKO retinae cells forming the rosette lumens were highly expressing N-cadherin and β-catenin (white arrows F and H); cells at the apical and basal surface were intermittently expressing N-cadherin (green arrows in F) and β-catenin (red arrows in H). Very few TUNEL-positive cells were identified in the control (I) and Adam10 CKO (J) retinae. Quantification analysis (K) identified in the controls 0.4 ± 0.01% (gray bar) and in Adam10 CKO 4.69 ± 0.11% (white bar) TUNEL-positive cells indicated a significantly greater (*P = 0.003; n = 3) percentage of TUNEL-positive cells in the Adam10 CKO retinae. Quantification analysis (L) identified 2476 ± 173 (gray bar) DAPI-positive cells in controls and 2096 ± 167 (white bar) DAPI-positive cells in Adam10 CKO retinae indicating that the overall number of retinal cells did not significantly differ (P = 0.19; n = 3) between the two genotypes. Bars in (K) and (L) represent mean values ± SEM. Significance was established following analysis with Student’s t-test and P<0.05 was considered significant. In all panels, nuclei were stained with DAPI. AP = apical surface. BA = basal surface. n.s. = not significant. Scale bar = 50 μm.
