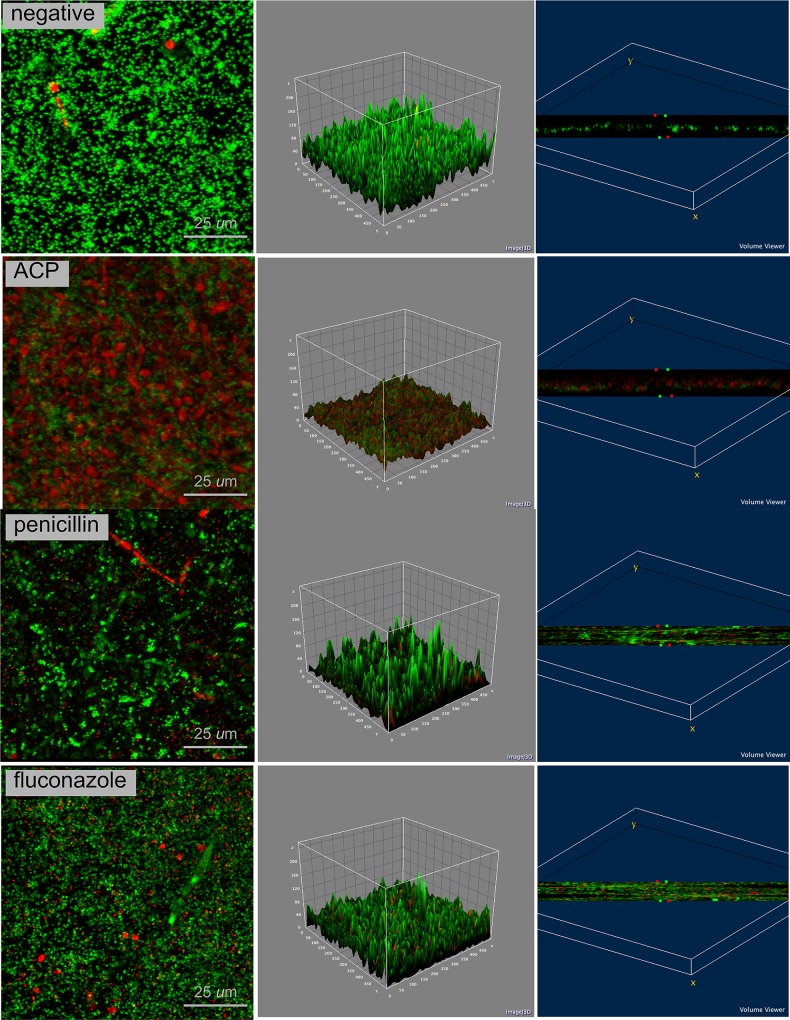
Fig 4. Confocal laser scanning microscopy of C. albicans + S. aureus biofilm in negative control group, ACP group and positive control groups (fluconazole and penicillin); 4 × zoom.
Biofilm stained with Live/Dead BacLight Viability kit. Live cells in fluorescent green and dead cells in fluorescent red. 2D view (left side image), surface plot of 3D volume image (center image), and cross-section of 3D volume image (right side image) show the distribution of live and dead cells throughout biofilm layers.

