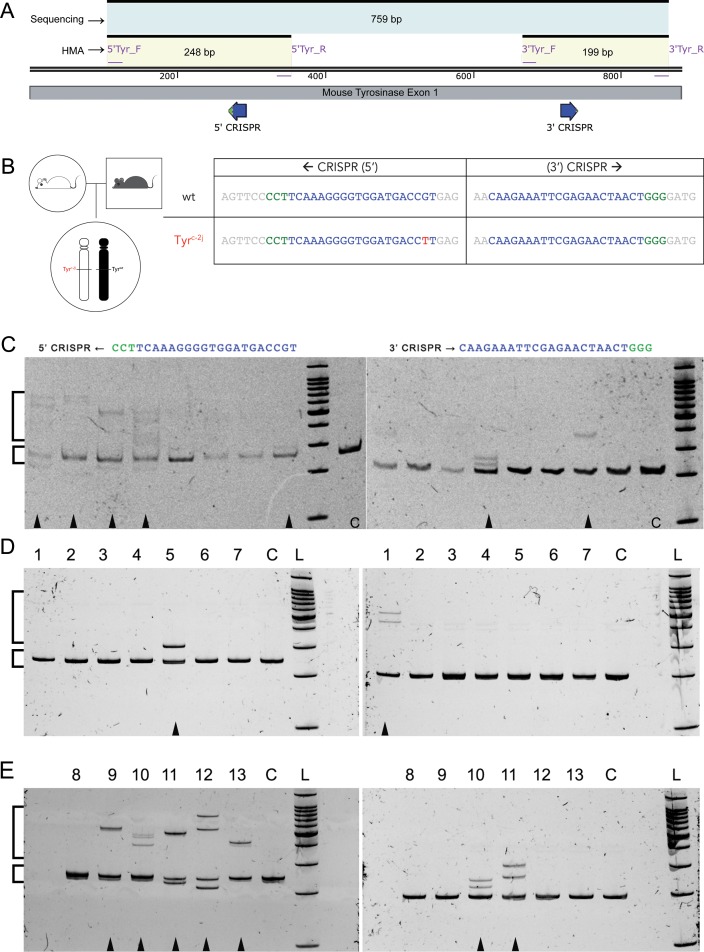
Fig 1. CRISPR targeting and mutation detection by heteroduplex mobility assay in the Tyr gene.
(A) Schematic showing CRISPR targeting regions (blue bold arrows), PCR primer binding sites, and amplicon sizes. (B) Breeding scheme with genotype of the zygotes used for CRISPR-Cas9 injections, and the CRISPR target sequences on both chromosomes. (C, D, E) Images of ethidium bromide stained polyacrylamide gels (6%) showing separation of homoduplex and heteroduplex PCR amplicons from CRISPR-Cas9 RNA injected, single cultured blastocysts (C, arrowheads) and tail DNA of potential founder mice (D, E). Gels on the left correspond to the 5’CRISPR target site, and those on the right correspond to the 3’CRISPR target site. Small and large square brackets indicate homoduplex and heteroduplex bands, respectively. L = 100 bp ladder; C = uninjected wildtype control.

