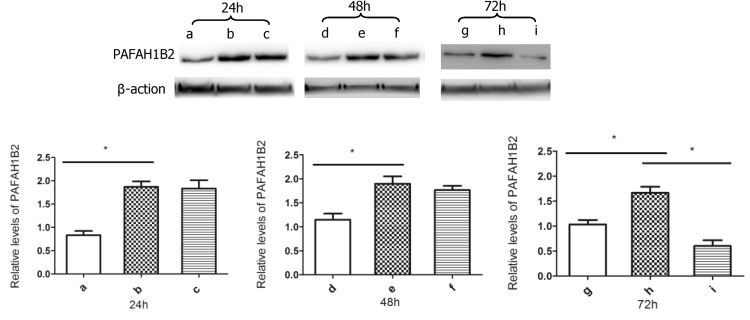
Fig 5. The expression of PAFAH1B2 in H7N9 infection.
The a, d and g were the relative levels of PAFAH1B2 in primary A549 cells. The b, e and h were the relative levels of PAFAH1B2 in A549 cells with recombinant plasmid. The c, f and i were the relative levels of PAFAH1B2 in A549 cells with recombinant plasmid infected by H7N9 virus at 24,48 and 72hpi. The date are shown the relative levels of PAFAH1B2 with SD (n = 3,*p<0.05).

