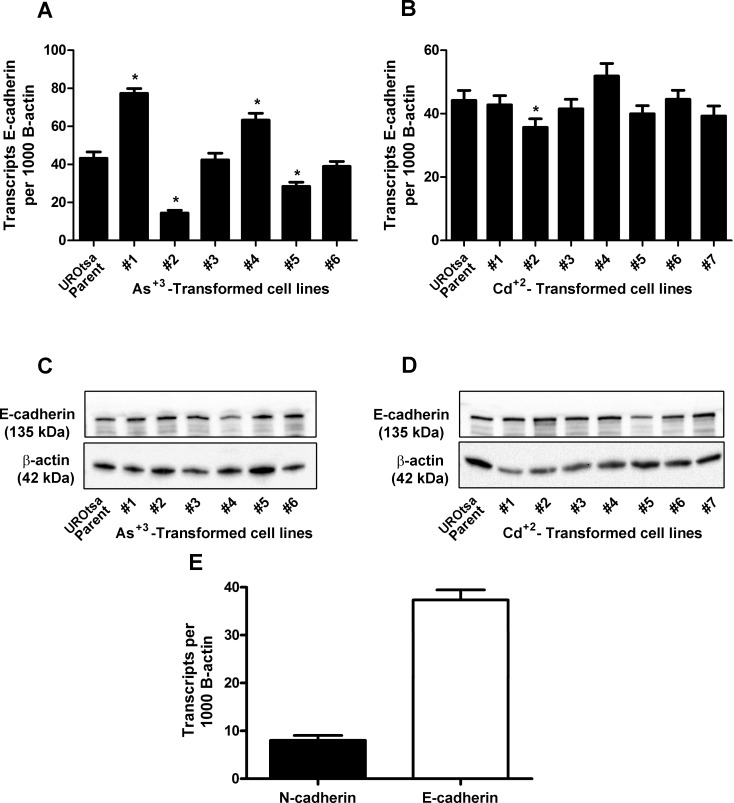
Fig 2. Expression of E-cadherin in the UROtsa parent and the As+3-and Cd+2-transformed cell lines.
(A and B). Real time-RT-PCR analysis of E-cadherin expression. The data is expressed as the number of transcripts of E-cadherin per 1000 transcripts of β-actin and is plotted as the mean ± SEM of triplicate determinations. (C and D). Western analysis of E-cadherin protein. (E). Comparison of N and E-cadherin mRNA expression in As#6. * denotes significant difference from UROtsa parent cells (p<0.05).

