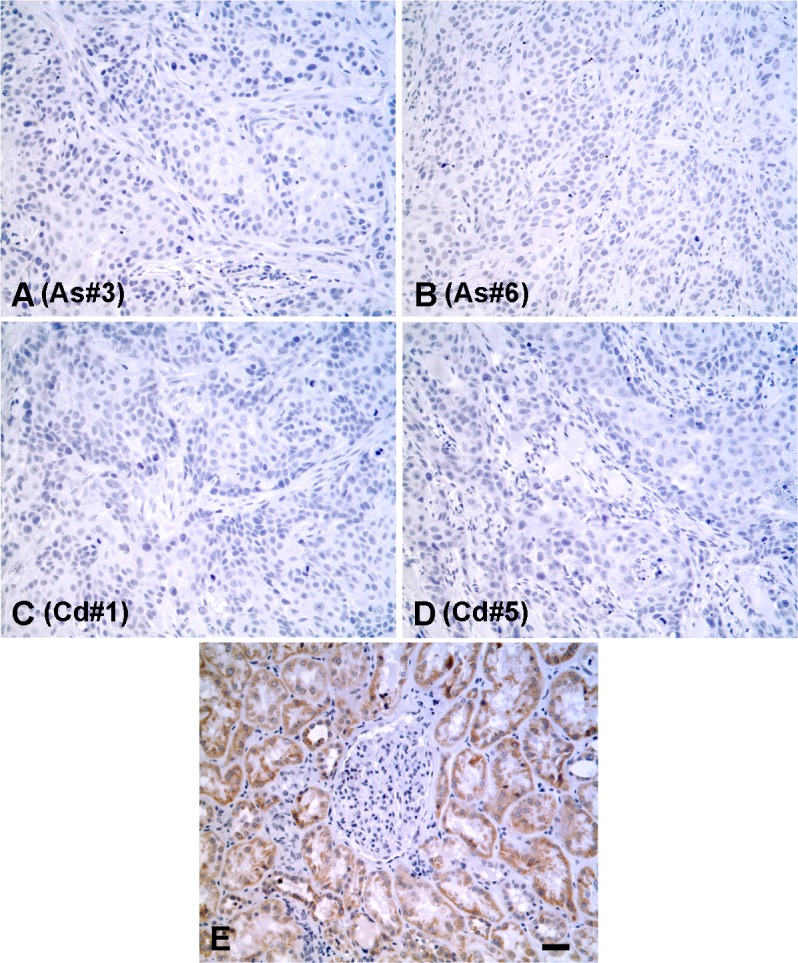
Fig 8. Immunohistochemical analysis of N-cadherin protein in tumor transplants generated from cancer initiating cell spheroids.

(A-D). Expression of N-cadherin protein in tumor transplants generated from As#3, As#6, Cd#1 and Cd#5 cancer initiating cell spheroids respectively. (E). Human kidney stained for N-cadherin as a positive control. The brown color indicates the presence of the protein whereas the blue color indicates the nuclei that were stained with the counterstain hematoxylin. All images are at a magnification of X200. Scale bar = 100 μm and is shown for panels A-E.
