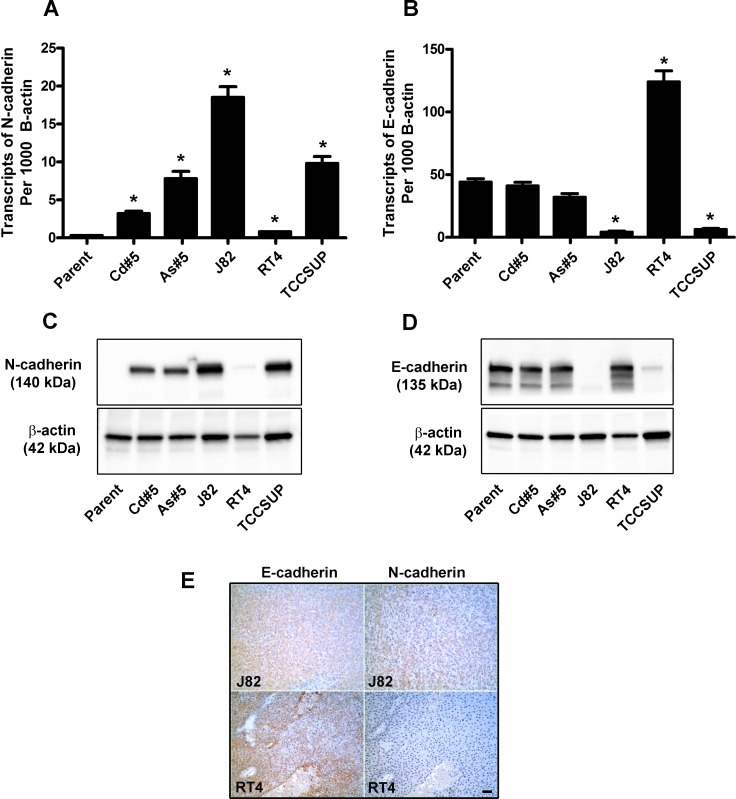
Fig 9. Expression of N and E-cadherin in J82, RT4 and TCCSUP urothelial cancer cell lines and tumor transplants.
(A and B). Real time-RT-PCR analysis of N and E- cadherin expression. The data is expressed as the number of transcripts of N and E-cadherin per 1000 transcripts of β-actin and is plotted as the mean ± SEM of triplicate determinations. (C and D). Western analysis of N and E-cadherin protein. * denotes significant difference from UROtsa parent cells (p<0.05). The expression level of N and E-cadherin in As#5 and Cd#5 are included for comparison. (E). Immuno-histochemical analysis of N and E-cadherin protein in tumor transplants. The brown color indicates the presence of the protein whereas the blue color indicates the nuclei that were stained with the counterstain hematoxylin. All images are at a magnification of X200. Scale bar = 100 μm.

