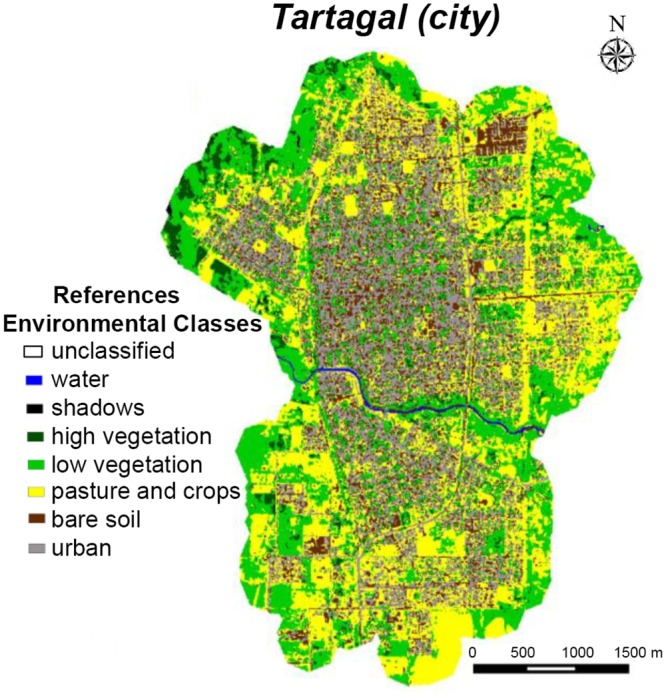
Fig 2. Land cover map of Tartagal city derived from an unsupervised classification (K-means) of SPOT 5 images, with seven different classes.

Reference: unclassified (black), water (blue), shadows (black), high vegetation (dark green), low vegetation (light green), pasture and crops (yellow), bare soil (brown) and urban (grey).
