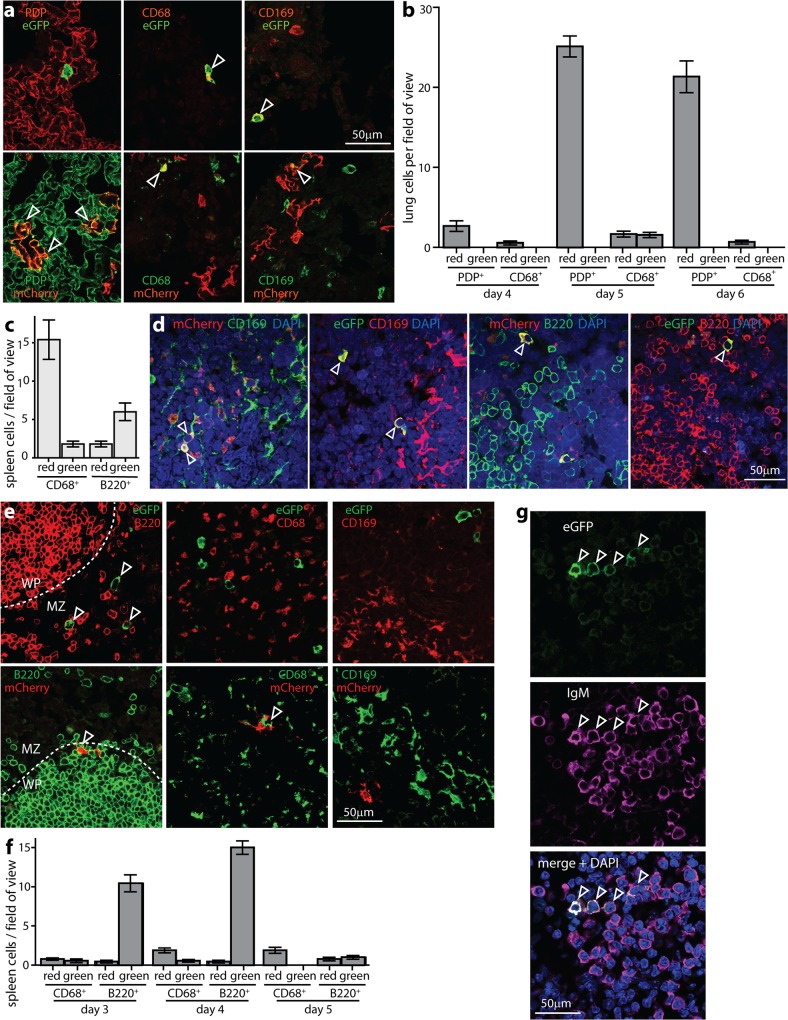
Fig 3. Viral fluorochrome switching in infected lung and spleen cells.
a. Mx1-cre mice were given i.n. poly(I:C) (50μg) to induce IFN-I 6h before and at the time of i.n. infection with MHV-RG (3x10⁴ p.f.u.). 5d later lung sections were stained for viral eGFP / mCherry, and the cell markers podoplanin (PDP, AEC1s), CD68 (macrophages) and CD169 (AMs). Each image is representative of 5 mice. Arrows show example positive cells. Quantitation is shown in b. The cytoplasmic rather than nuclear distribution of eGFP is typical for the relatively mild fixation of periodate-lysine-1% formaldehyde. b. Lung sections of mice infected as in a (5 per group) were analysed at d4-6, counting eGFP+ (green) and mCherry+ (red) PDP+ and CD68+ cells for 3 sections per mouse. Each section corresponds to approximately 10 fields of view as illustrated in a. Bars show mean ± SEM. At d5 CD68+ cells showed significantly more fluorochrome switching than PDP+ cells (p<0.01). c. Mx1-cre mice were infected i.p. with MHV-RG (105 pfu), and eGFP+ (green) and mCherry+ (red) MZ macrophages (CD169+) and B cells (B220+) counted 4d later. Bars show mean ± SEM counts for 3 sections each of 3 mice per group. B220+ cells were significantly more switched than unswitched, whereas CD169+ were significantly more unswitched than switched (p<0.02). d. Example images of mice infected as in c. Arrows show positive cells. e. Mx1-cre mice were infected i.p. with MHV-RG (105 pfu), as in d, but poly(I:C) (50μg i.p.) was given 6h before and at the time of infection to test the effect of increased IFN-I induction. Spleen sections were analysed at d4 for viral eGFP and mCherry expression in B220+ B cells and CD68+CD169+ MZ macrophages. Arrows show example positive cells. Quantitation is shown in f. f. Mean ± SEM counts are shown for 3 sections each of 5 mice per group, analysed as in e at d3-5 post-infection. Each field of view was 10x the area of the images shown in e, and we counted at least 10 fields of view per section (at least 200 viral fluorochrome+ cells). B220+ cells showed significantly more switched than unswitched fluorochrome expression at d3 and d4 of infection (p<10−4). CD68+ cells did not (p>0.5). g. Mice were infected as in e and infected MZ B cells identified by staining for IgM. WP B cells express lower levels of IgM and while this is detectable by flow cytometry, by confocal microscopy as used here, WP B cells are IgD+IgM- [3]. >90% of infected MZ B cells were eGFP+, confirming the results of e-f.

