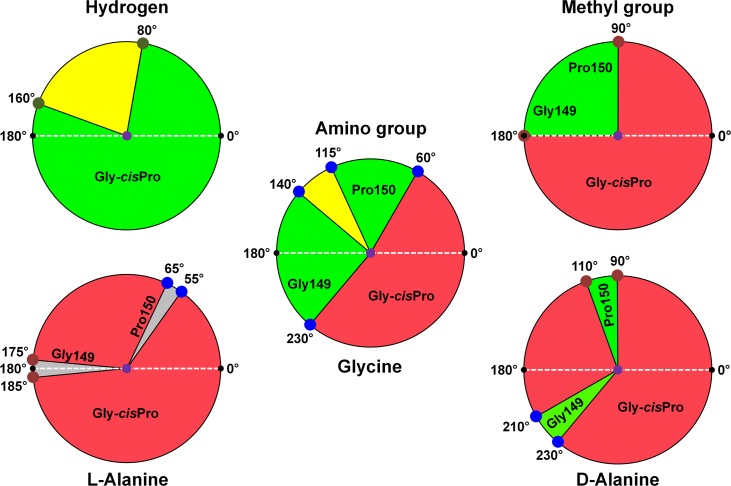
Fig 4. Mechanistic design principle of the active site of DTD.
Schematic showing the relative orientations of different groups attached to Cɑ of the ligand when viewed down Cα–C bond (centre of the wheel). The carboxyl plane of the ligand, represented as a white dashed line, with the two oxygen atoms at 0° and 180°, has been taken as the reference for calculating the angular sweeps. The top two wheels and the middle wheel represent each group attached to the chiral centre individually, while the bottom two wheels and the middle wheel represent each of the three ligands—L-alanine (with methyl and amino groups), glycine (with amino group only), and D-alanine (with methyl and amino groups). The following colour coding for different groups has been used: H: dark green, NH2: blue, CH3: brown. The delineation of regions is based on the following distance criteria from Gly149 O or Pro149 O for each group: H, 2.0 Å to 3.0 Å; NH2, 2.5 Å to 3.5 Å; CH3, 3.0 Å to 4.0 Å [34]. Regions falling within the range are favoured (green: region of interaction), above the range are allowed (yellow: region of no interaction), and below the range are disallowed (red: region of steric clash). In the case of L-alanine, the amino acid can be squeezed in the pocket with the methyl group positioned at 3.0 Å from the Gly149 O at 180° and the amino group at 2.5 Å from Pro150 O at 60°; hence, the possible allowed region for L-alanine has been shaded grey, and any other positioning of the methyl group would result in more serious clashes. Calculations are based on protein-based superimposition of all the monomers of PfDTD+Gly3AA complex and the average Cɑ, C, and O positions of the glycyl moiety. For distance measurements, all the observed orientations of Gly-cisPro motif are taken into consideration, thereby accounting for the plasticity of the active site.

