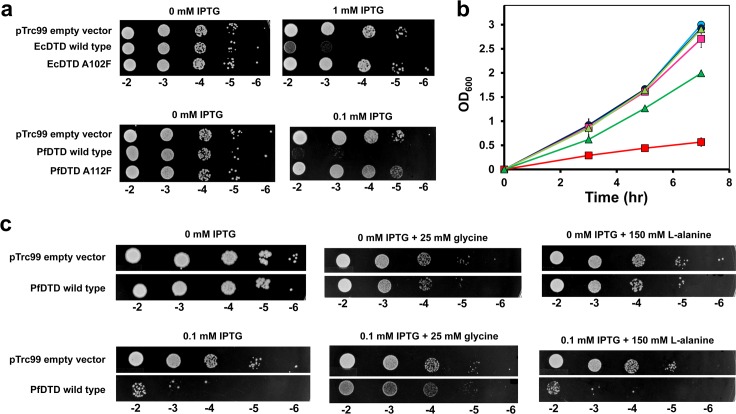
Fig 6. DTD overexpression causes cellular toxicity.
(a) Spot dilution assay of E. coli K12Δdtd::Kan complemented with pTrc99 empty vector, EcDTD/PfDTD wild-type, or EcDTD A102F/PfDTD A112F. (b) Growth curve of E. coli K12Δdtd::Kan complemented with pTrc99 empty vector uninduced (light blue circle) or induced (dark blue circle), PfDTD wild-type uninduced (pink square) or induced (red square), and PfDTD A112F uninduced (light green triangle) or induced (dark green triangle); induction with 0.1 mM IPTG. Error bars indicate one standard deviation from the mean. (c) Spot dilution assay of E. coli K12Δdtd::Kan complemented with pTrc99 empty vector or PfDTD wild-type. The top panel represents uninduced cultures (i.e., 0 mM IPTG), whereas the bottom panel corresponds to cultures induced with 0.1 mM IPTG. The cultures are unsupplemented or supplemented with 25 mM glycine or with 150 mM L-alanine. The underlying data of panel (b) can be found in S1 Data.

