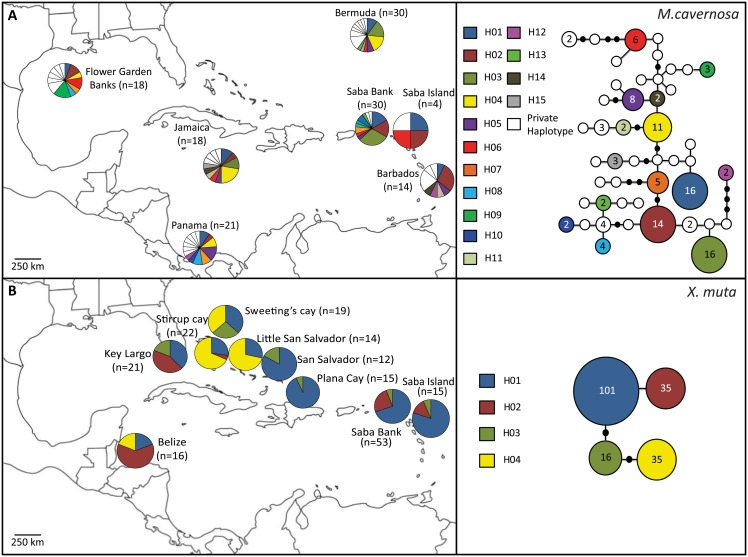
Fig 2. Frequency and distribution of haplotypes in populations of Montastraea cavernosa (A) and Xestospongia muta (B) in the wider Caribbean region.
Haplotype frequencies provided as pie-chart per location, number of samples in brackets. Haplotype network of ITS (A) and I3-M11 (B), baes on all sequences collected throughout the wider Caribbean region. Size of circle reflects the number of individuals with a specific haplotype. Each line represents the genetic distance between haplotypes. Specific haplotype colors match those presented in the pie-charts. White circles (ITS) are haplotypes private to a certain location.

