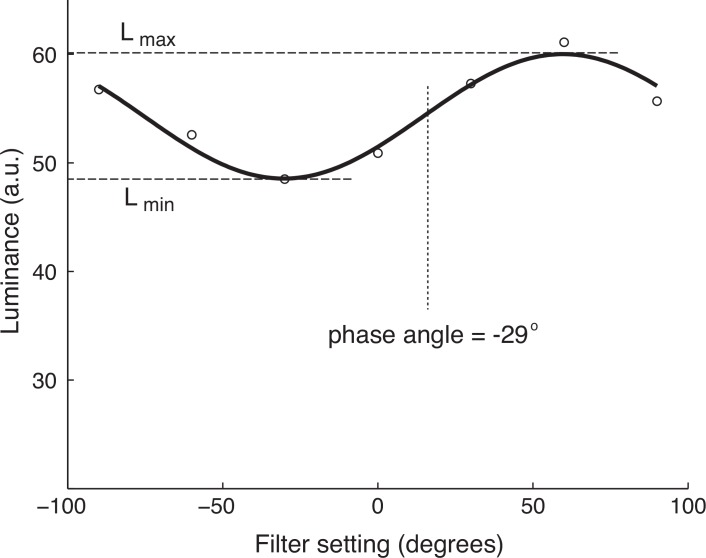
Fig 2. Derivation of extracted quantities from fitted sinusoids.
This shows a single fit to the white stripes from a single ROI (foreleg in Fig 1). The phase angle corresponds to the offset of the fit from odd symmetry around the midpoint filter setting, which in this case was approximately 30 degrees. The d value is calculated from the contrast between the maximum and minimum values of the fit curve. It is important to note that the phase angle parameter is not the same as the angle in which more polarized light is present, but is linearly related to this physical parameter. See methods for details.

