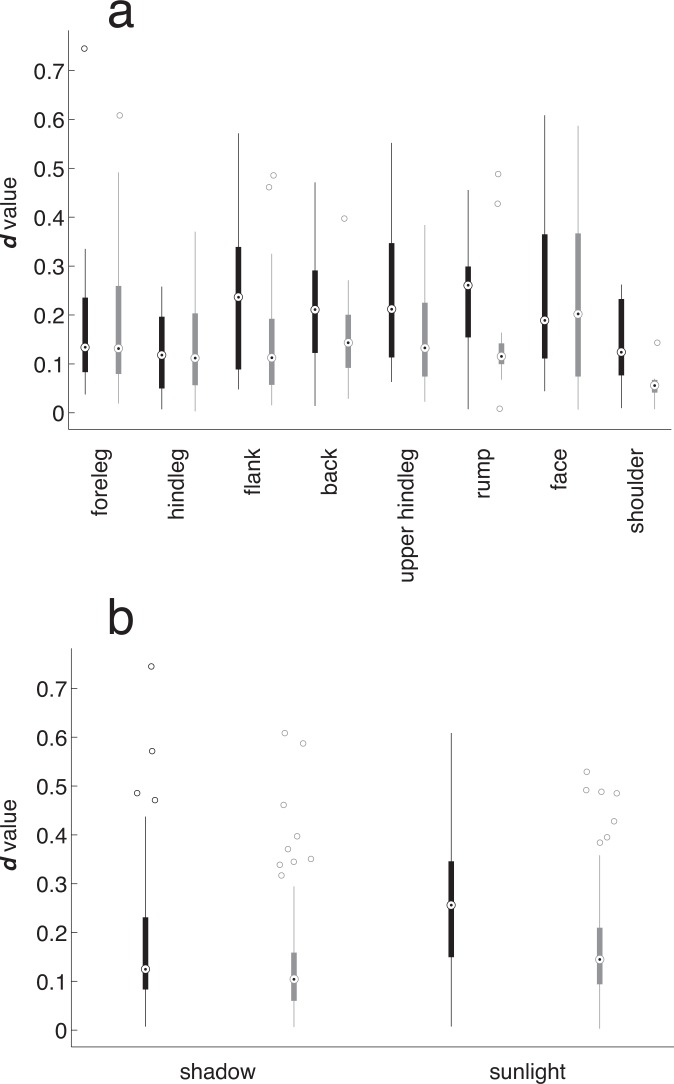
Fig 4. Box/whisker plot showing the distributions of d values in different ROIs for black and white stripes under different illumination conditions.
In each column, the dot surrounded by a circle depicts the mean, the box shows the quartiles, the whiskers the 95% confidence intervals, and the “o” symbols show outliers.

