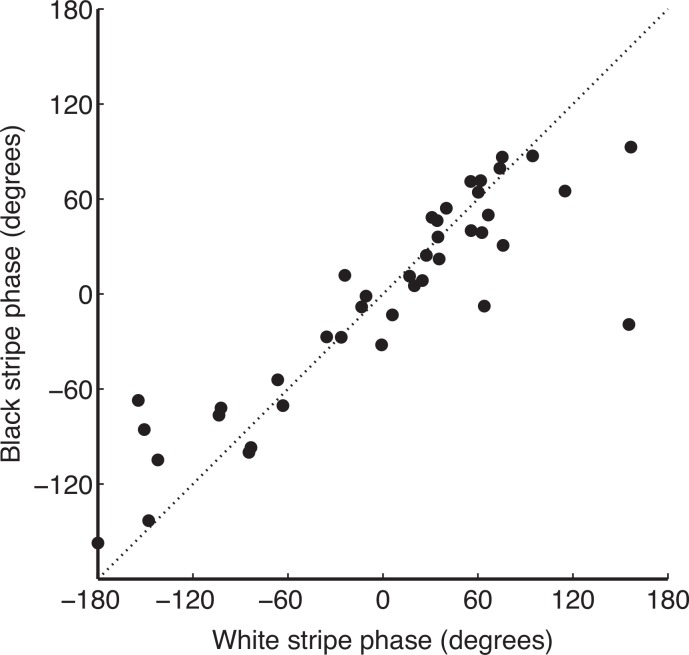
Fig 5. Correlation between fit phases in black and white stripes.
Each data point represents a single ROI in a single zebra, and the phases of each were fit independently. Note the high degree of correlation evident in the data; outliers were present but rare. Because phase could only be accurately estimated in data where the d value was high, this analysis is restricted to the cases where there was a significant correlation between data and fit.

