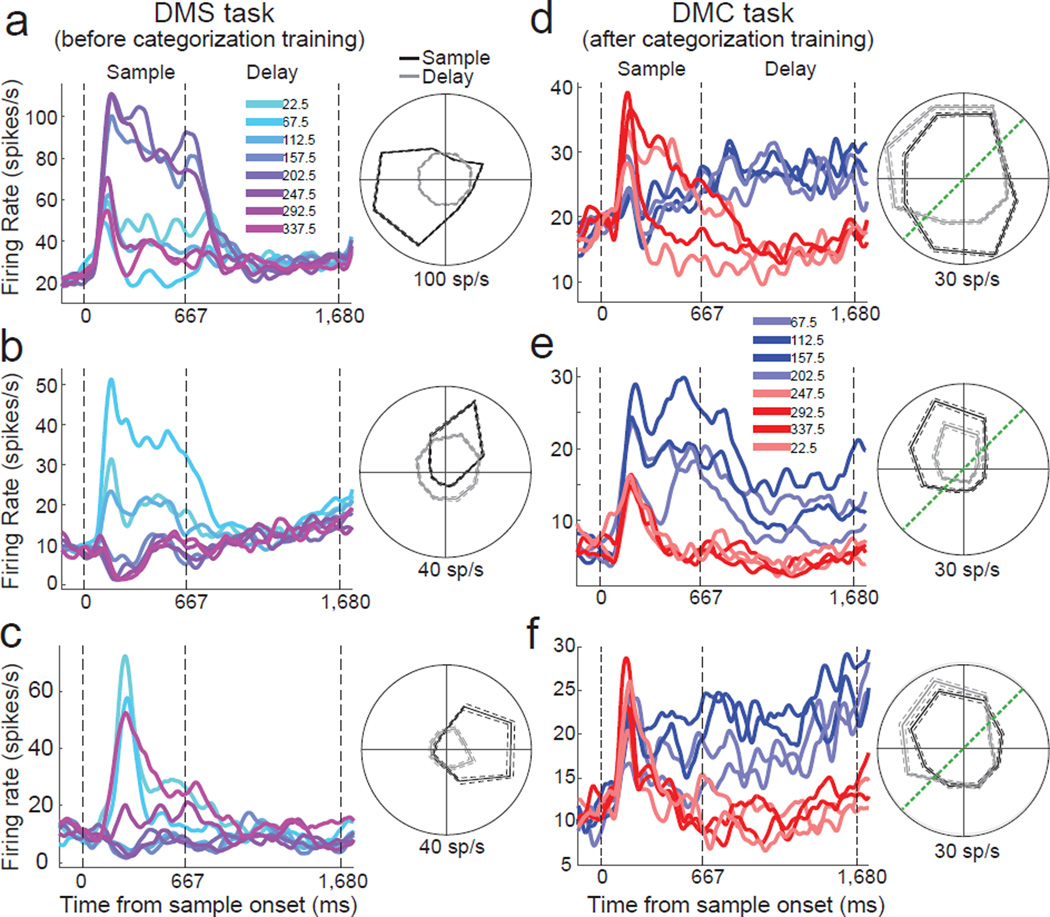
Figure 3. Example LIP neurons during the DMS and DMC tasks.
Average activity evoked by 8 sample directions for three LIP neurons from the DMS (a–c) and DMC (d–f) tasks. Different traces indicate different sample directions and are colored according to their direction (and category membership for the DMC task). The three dashed, vertical lines represent the start of the sample epoch, the end of the sample epoch, and the end of the delay epoch, respectively. Polar plots are shown for average firing rates by sample direction during sample (black) and delay (gray) periods. In (d–f) dark blue and dark red traces indicate sample directions near the middle of categories 1 and 2, respectively, while light blue and light red traces indicate sample directions near the category boundary. All cells shown were direction selective during the sample period (one-way ANOVA, P<0.01). All cells except for (a) were also direction selective during the delay period. The dashed green lines on the polar plots indicate the position of the category boundary.

