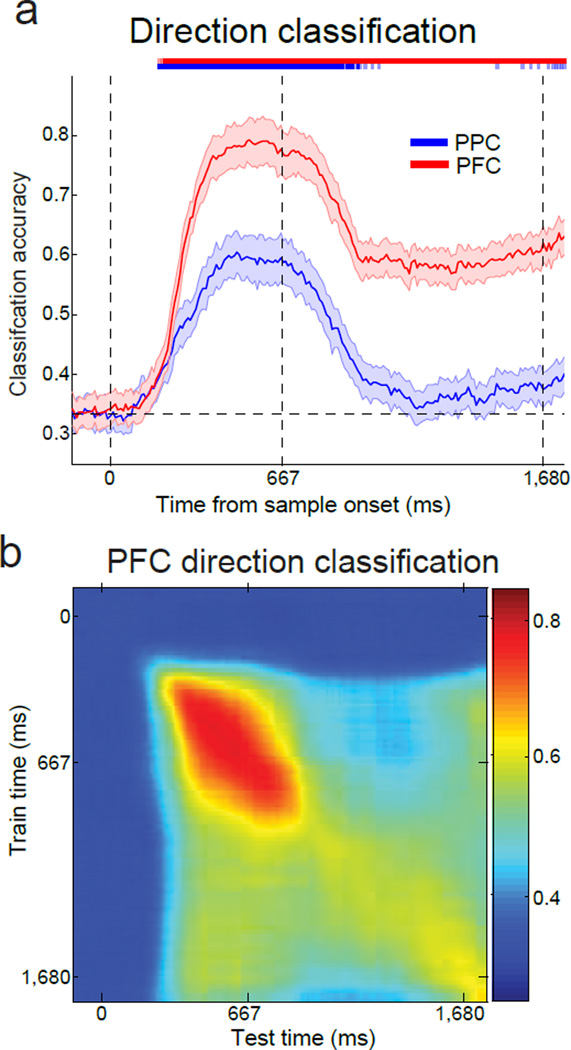
Figure 7. Time-course of direction classification in PPC and PFC.
(a) Sample motion direction classification accuracy for Monkeys Q and W. Similar to Figure 5a, direction was decoded independent of category. The classification accuracy is shown for the PPC (blue curve) and the PFC (red curve). The three dashed, vertical lines represent the start of the sample epoch, the end of the sample epoch, and the end of the delay epoch, respectively. Error bars indicate SEM. The light and dark colored bars at the top of the panel indicate times at which classification accuracy for PPC (blue) and PFC (red) was significantly above chance (light, P<0.05, dark, P<0.01, bootstrap). (b) Similar to Figure 5c, the stability of direction encoding in PFC was determined by training the classifier at one time point (y axis) and testing at a second time point (x axis). Classification accuracy is indicated by color at each x–y coordinate. Direction classification accuracy in PFC was above chance during both the sample and delay epochs, with stronger values near the diagonal, suggesting a combination of stable and dynamic direction encoding.

