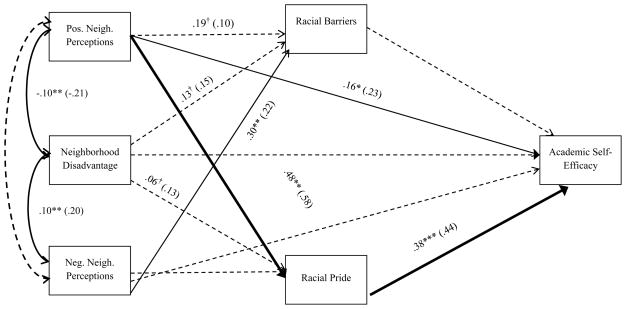
Figure 1.
Model for academic self-efficacy. Pos. = Positive. Neg. = Negative. Neigh. = Neighborhood. Estimates for demographic variables are not presented in the figure. Unstandardized and standardized (in parentheses) coefficients are shown. Bolded arrows signify a significant indirect path, and dashed lines indicate non-significant paths. Adjusted for gender, grade, and race-ethnicity. Correlations among other exogenous variables not shown for ease of presentation. * p < .05. ** p < .01. *** p < .001. †= p < .10

