. 2016 Apr 20;5:e13442. doi: 10.7554/eLife.13442

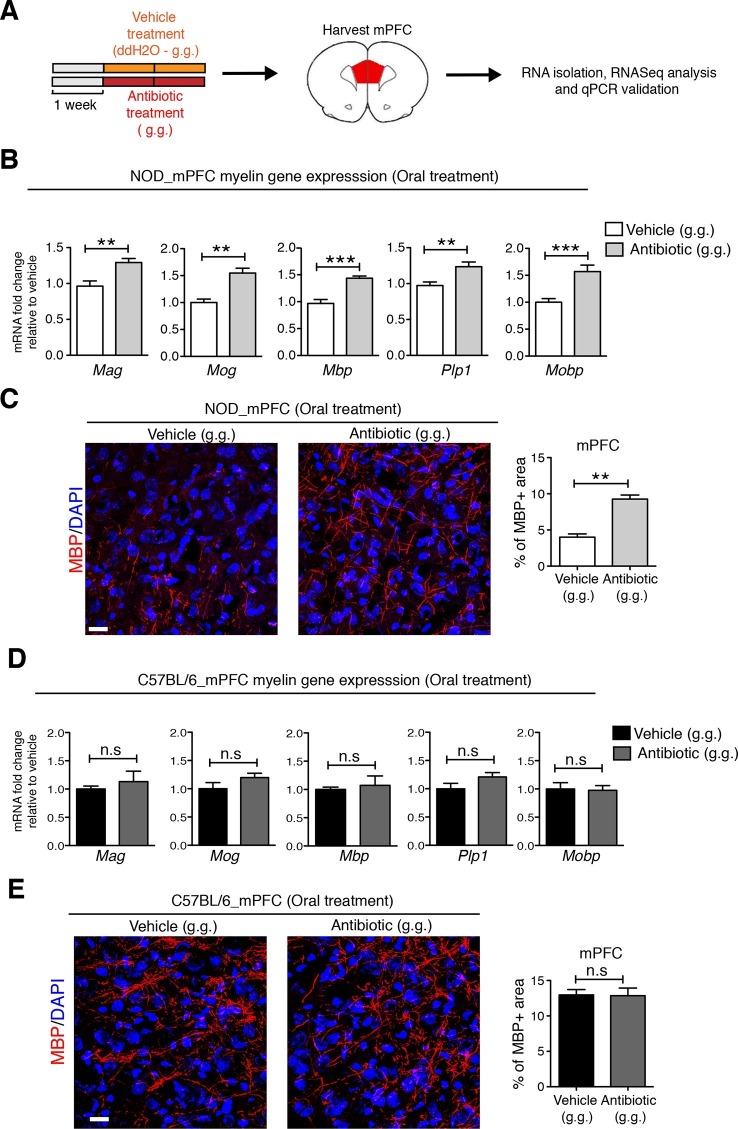
Figure 4. Myelin transcripts and myelinated fibers in the medial prefrontal cortex (mPFC) of adult NOD mice with social avoidance behavior.

(A) Experimental timeline: vehicle or antibiotic mix were administered daily by gastric gavage (g.g.) for 14 days and mPFC was harvested for RNA extraction and quantitative real-time qPCR or immunohistochemsitry (B,D) qPCR of myelin transcripts after vehicle or antibiotic treatment of NOD (B) and C57BL/6 (D) mice. Values were normalized to 36b4 mRNA levels and are referred as fold change relative to vehicle-treated values (n=6 mice per group). (C,E) Representative confocal images and quantification of MBP+ fibers (red) in mPFC of NOD (C) and C57BL/6 (E) mice after vehicle or antibiotic treatment. DAPI (blue) was used as nuclear counterstain. Scale bar, 50 μm. Graph represents quantification of MBP+ fibers per surface area (n=3 for NOD; n=4 for C57BL/6). Data are mean ± S.E.M; **p<0.01, ***p<0.001 based on unpaired t test. n.s. indicates not significant.

DOI: http://dx.doi.org/10.7554/eLife.13442.011

Figure 4.

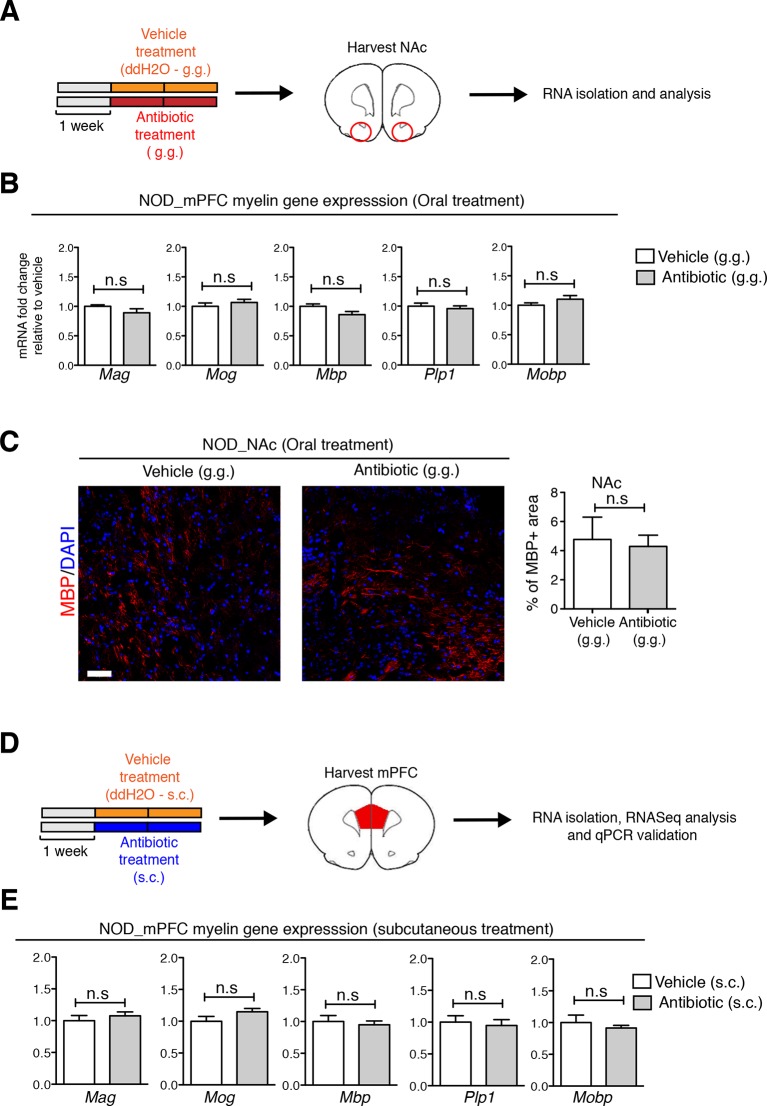
Figure 4—figure supplement 1. Regional specificity of myelin changes in response to antibiotic treatment.

Figure 4—figure supplement 1.

(A) Experimental timeline: vehicle or antibiotic mix were administered daily by gastric gavage (g.g.) for 14 days and nucleus accumbens (NAc) was harvested for RNA extraction and quantitative real-time qPCR or immunohistochemsitry. (B) qPCR of myelin transcripts in the NAc after oral treatment in NOD mice. Values were normalized to 36b4 mRNA levels and are referred as fold change relative to vehicle-treated values (n=6 mice per group). (C) Representative confocal images and quantification of MBP+ myelinated fibers (red) in the NAc of NOD mice after vehicle or antibiotic treatment. DAPI (blue) was used as nuclear counterstain. Scale bar, 20 μm. Graph represents quantification of MBP+ fibers per surface area (n=3 mice per group). (D) Experimental timeline of subcutaneous treatment (vehicle or antibiotic). (E) qPCR of myelin transcripts in the mPFC after 14 days of subcutaneous treatment (s.c.). Values were normalized to 36b4 mRNA levels and referred as fold change relative to vehicle-treated values (n=6 mice per group). Data are mean ± S.E.M; statistical differences were determined using unpaired t tests. n.s. indicates not significant.
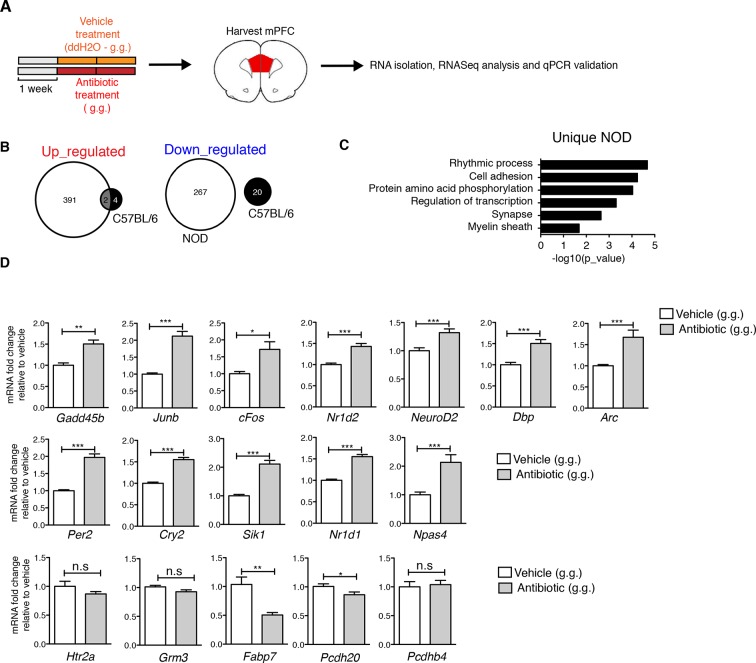
Figure 4—figure supplement 2. Effect of oral antibiotic treatment on the transcriptional profile in medial prefrontal cortex (mPFC).

Figure 4—figure supplement 2.

Unbiased genome-wide transcriptomic analysis of mPFC was performed after 14 days of either oral antibiotic or vehicle treatment (NOD and C57BL/6; n=2 mice per group). (A) Experimental timeline: vehicle or antibiotic mix were administered daily by gastric gavage (g.g.) for 14 days. (B) Venn diagram representing up- and downregulated genes after antibiotic treatment in both mouse strains. (C) Graph shows the results of DAVID gene ontology analysis using uniquely differentially expressed genes between vehicle and antibiotic treated NOD mice. (D) qPCR validation of the transcriptional changes detected by RNA-sequencing. Values were normalized to 36b4 mRNA levels and are referred as fold change relative to vehicle-treated values (n=6 mice per group). Data are mean ± S.E.M; *p<0.05, **p<0.01, ***p<0.001 based on unpaired t test. n.s. indicates not significant. See Gacias et al. (2016).