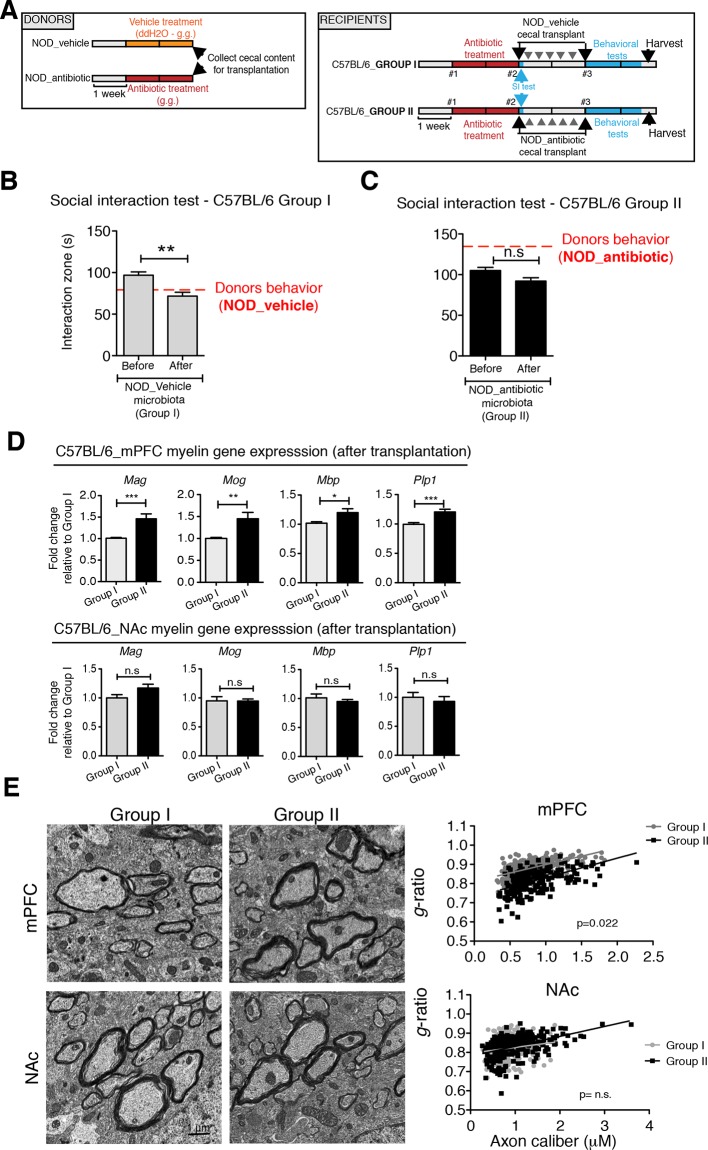
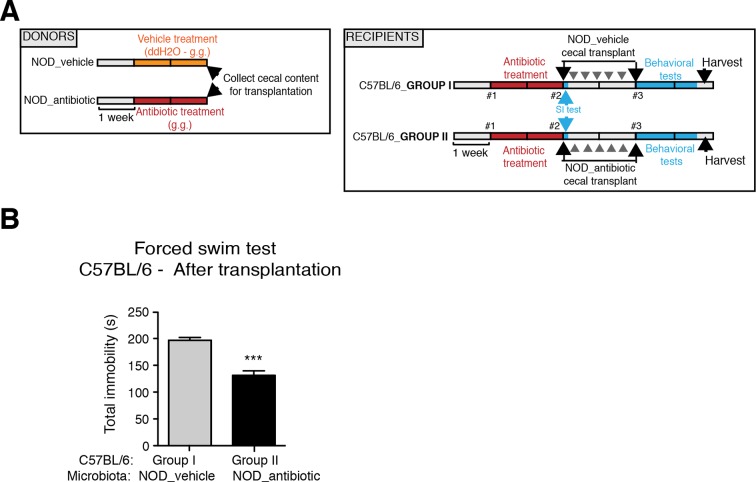
Figure 5. Social avoidance behavior transfer from NOD donors to microbiota depleted C57BL/6 by fecal transplantation.
(A) Experimental timeline for donor (NOD) and transplant-recipient (C57BL/6) mice. (B,C) Results from Social Interaction (SI) tests conducted in C57BL/6 recipients before and after transplantation with either microbiota from vehicle-treated (Group I; B) or antibiotic-treated (Group II, C) NOD mice. Graphs represent the amount of time spent (seconds) in the interaction zone when a target is present. Red dashed bar represents the interaction time of the NOD donors. Data are mean ± S.E.M; *p<0.05, **p<0.01 based on a two-way ANOVA (n=12 mice per experiment, 2 replicates of 12 for a total of 24 mice per condition). (D) Graphs indicate the relative levels of myelin gene transcripts in mPFC and NAc of C57BL/6 recipients displaying (Group I) or not displaying (Group II) social avoidance behavior after transplantation with NOD microbiota (n=6–8 mice per group; *p<0.05, **p<0.01, ***p<0.001 based on unpaired t test). (E) Electron micrographs and quantified g-ratios of myelinated axons in mPFC and NAc in Group I and Group II C57BL/6 recipients after transplantation with the NOD microbiota. Scale bar, 1 μm. (n=3 per treatment and condition; statistical differences between groups were determined using two-tailed t-test; n.s. indicates not significant).


