. 2016 Apr 20;5:e13442. doi: 10.7554/eLife.13442

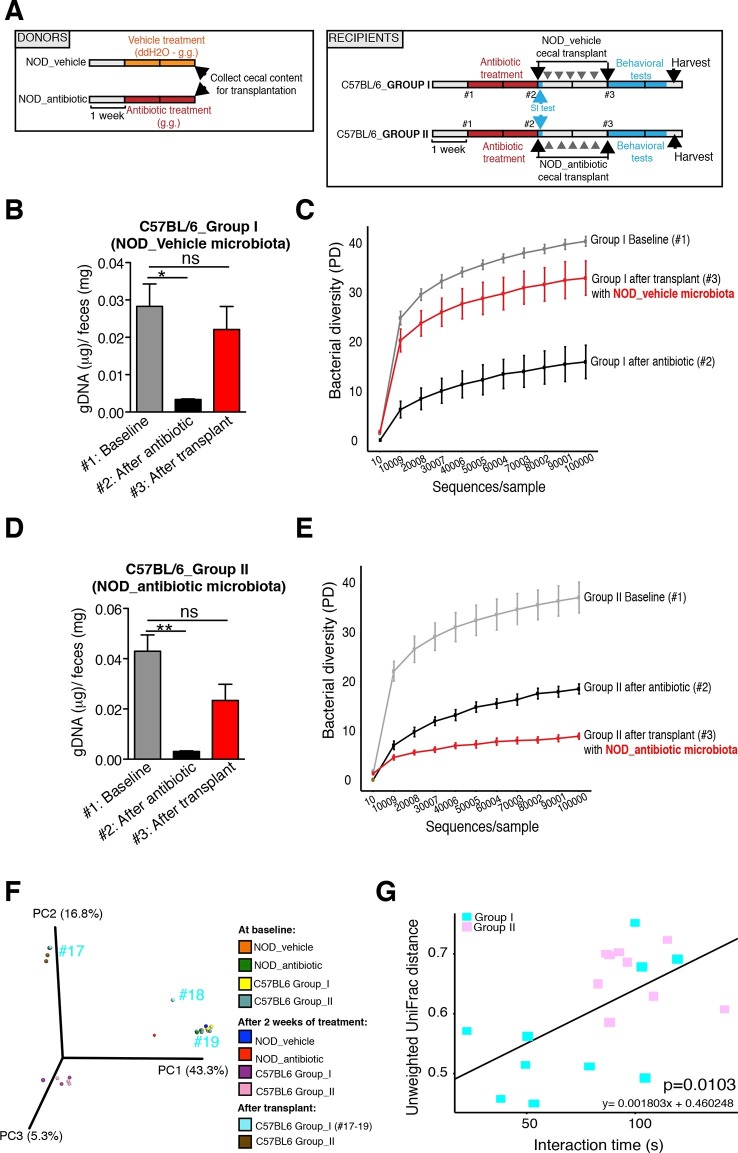
Figure 6. Effect of fecal transplantation on bacterial mass and biodiversity in microbiota depleted C57BL/6 recipients.

(A) Experimental timeline for donors (NOD) and transplanted recipients (C57BL/6). (B,C) Graphs represent fecal biomass (µg of gDNA relative to total fecal weight) of C57BL/6 recipients prior to transplantation (#1 before and #2 after 14 days of antibiotic treatment) and at end point after-transplantation (#3) with donor microbiota (n=3 pooled samples per time-point, each sample represents 1 sample = pooled feces from 3–5 mice. Data are mean ± S.E.M; *p<0.05, **p<0.01 based on one-way ANOVA with Bonferroni’s post hoc test). (C,E) Rarefaction curves comparing alpha diversity of fecal microbiota samples from C57BL/6 recipients at different experimental time-points (#1, #2, and #3). (F) Principal coordinate analysis plot of unweighted UniFrac distances of fecal samples from NOD donors and C57BL/6 mice at different time-points. (#1, #2, and #3). Each dot represents the microbiota of a sample, colored by group, treatment, and time-point (n=3 pooled samples per time-point; each sample corresponds to pooled feces from 3–5 mice). The percentage of variation explained by each principal coordinate (PC) is shown in parentheses. (E) Relationship between social interaction time and unweighted UniFrac distance to NOD donor mice (n=3) for all C57BL/6 recipients (n=10). Each point represents a single C57BL/6 animal, colored by group (light blue: Group_I, transplanted with NOD-vehicle microbiota; pink: Group_II, transplanted with NOD-antibiotic microbiota). Linear regression analysis indicates a significant correlation (p=0.0103) between the variables.

DOI: http://dx.doi.org/10.7554/eLife.13442.016

Figure 6.

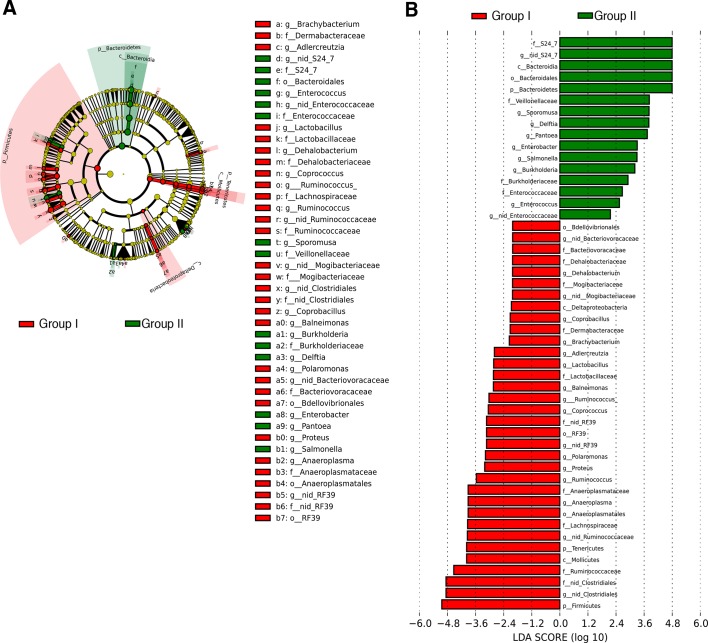
Figure 6—figure supplement 1. Transfer of social avoidance behavior is associated with altered colonic composition of the microbiota.

Figure 6—figure supplement 1.

(A) Cladogram generated from LEfSe analysis showing the most differentially abundant taxa enriched in C57BL/6 recipients with (Group I, red) or without (Group II, green) social avoidance behavior. (B) Linear discriminant analysis (LDA) scores of the differentially abundant taxa in cecal tissue from C57BL/6 recipients with (Group I, red) or without (Group II, green) social avoidance behavior. Graphs shows taxa enriched with a positive or negative LDA score (significant taxa [p<0.05, Kruskal–Wallis] with LDA score >2 are shown) (n=10–12 samples per group). See Gacias et al. (2016).
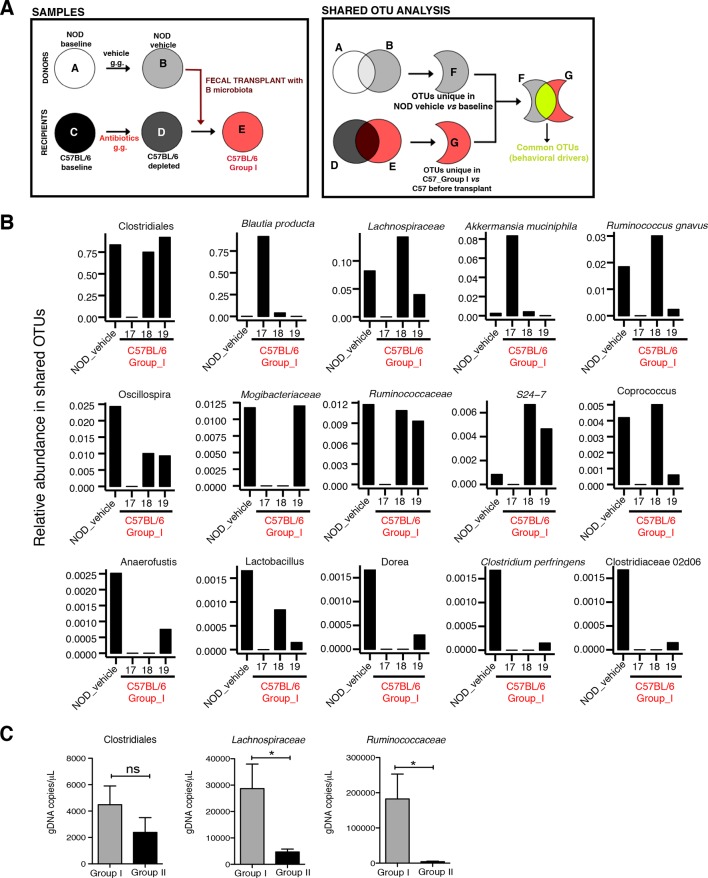
Figure 6—figure supplement 2. Social avoidance behavior is associated with enrichment of specific OTUs.

Figure 6—figure supplement 2.

(A) Schematic representation of microbiota and Operational Taxonomic Unit (OUT) analysis. (B) Relative abundance of the OTUs enriched in mice with social avoidance behavior (vehicle-treated NOD donors) and C57BL/6 Group I recipients (samples #18–19). Note that the sample #17 was from mice without the behavioral phenotype. See Gacias et al. (2016). (C) Quantitative real-time PCR analysis of genomic DNA extracted from gut tissue of C57BL/6 mice transplanted with microbiota from vehicle- or antibiotic-treated NOD mice (Group I and Group II, respectively) to quantify total bacteria of the order Clostridiales, and the families of Lachnospiraceae and Ruminococcaceae (n=6 mice per group). Data are mean ± S.E.M; *p<0.05 based on unpaired t test; n.s. indicates not significant.
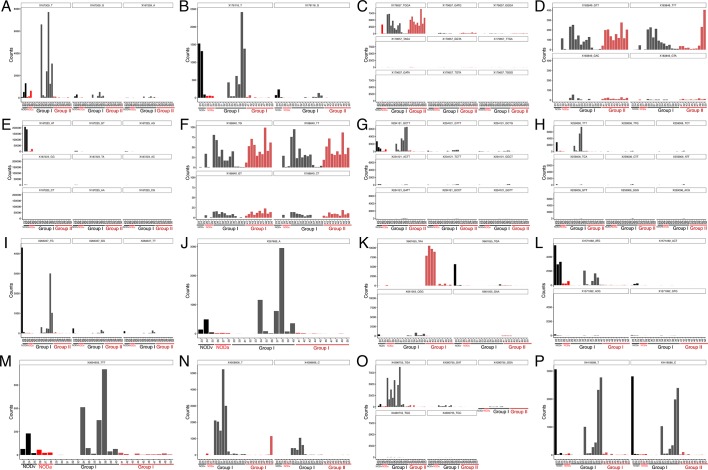
Figure 6—figure supplement 3. Oligotype analysis of gut tissue samples.

Figure 6—figure supplement 3.

Each panel represents the counts per sample for different oligotypes, identified by nucleotide sequence, within a specific Operational Taxonomic Unit (OTU), named by its Greengenes 13–8 identifier. Individual samples are represented in x axis and colored by group; Black: NOD_vehicle donors (NODv), Red: NOD_antibiotic donord (NODa); Gray: C57BL/6 Group I (transplanted with NOD vehicle-treated microbiota); light red: C57BL/6 Group II (transplanted with NOD antibiotic-treated microbiota) (A) OTU 167509 g__Oscillospira; s__ (B) OTU 176118 g__Oscillospira; s__ (C) OTU 179657 f__Lachnospiraceae; g__; s__ (D) OTU 183849 g__Blautia; s__producta (E) OTU 187223 g__Ruminococcus; s__ (F) OTU 188840 f__Lachnospiraceae; g__; s__ (G) OTU 234121 o__Clostridiales; f__; g__; s__ (H) OTU 259006 o__Clostridiales; f__; g__; s__ (I) OTU 263337 g__Oscillospira; s__ (J) OTU 267689 f__Ruminococcaceae; g__; s__ (K) OTU 661055 o__Clostridiales; f__; g__; s__ (L) OTU 1571092 o__Clostridiales; f__; g__; s__ (M) OTU 3694603 f__Lachnospiraceae; g__; s__ (N) OTU 4008606 f__Lachnospiraceae; g__; s__ (O) OTU 4390755 g__Anaeroplasma; s__ (P) OTU 4418586 o__Clostridiales; f__; g__; s__.