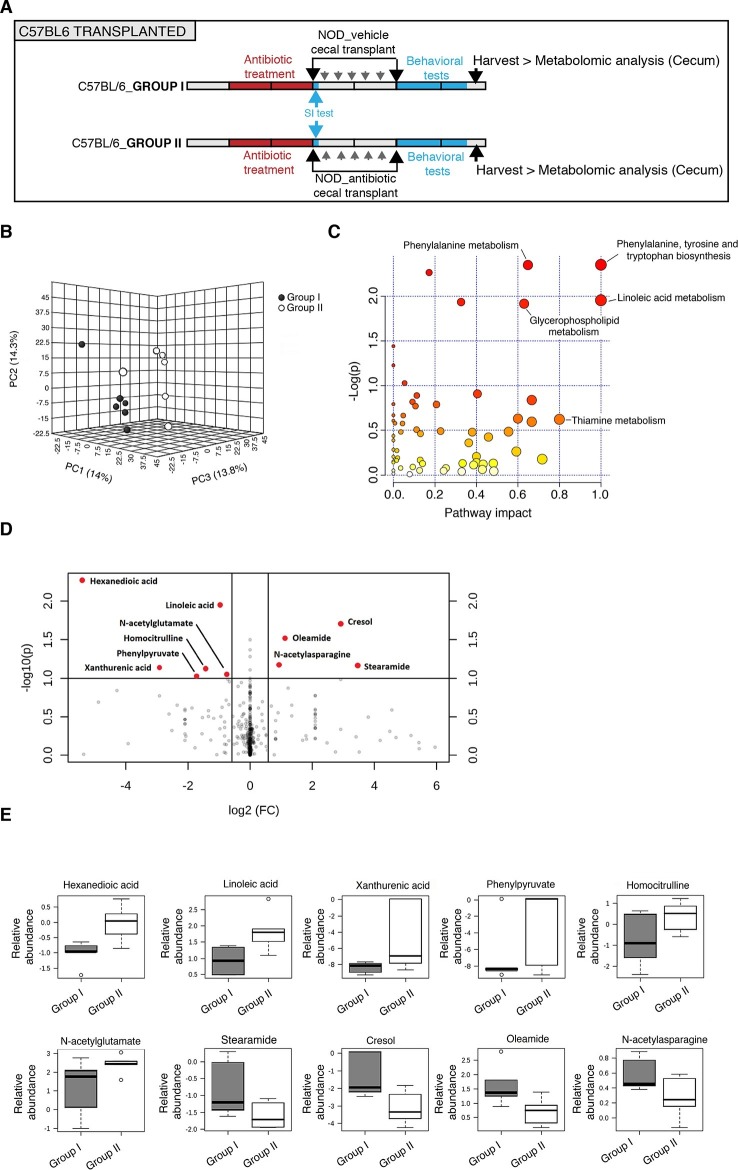
Figure 7. Metabolomic analysis of gut tissue from microbiota-transplanted C57BL/6 mice.
(A) Experimental timeline. (B) 3D plot of scores between selected components generated by PLS-DA analysis comparing Group I (transplanted with microbiota from vehicle-treated NOD mice; filled circles) and Group II (transplanted with microbiota from antibiotic-treated NOD mice; open circles). (C) Metabolic pathway impact overview generated with MetaboAnalyst 3.0. Unaltered pathways have a score of 0, and the most impacted pathways have higher scores. Pathways having the least statistical significance score are uncolored, whereas pathways having a high statistical significance score are colored in red. See Gacias et al. (2016). (D) Metabolites with the greatest differential between mice with (Group I) and without (Group II) behavioral phenotype, were selected by volcano plot with a fold-change threshold of 1.5 (x axis) and t test threshold of 0.1 (y axis). Red circles represent metabolites above the threshold (Group II vs Group I); see Table 1. (E) One-way analysis of variance box and whisker plots illustrating the metabolite changes observed in Groups I and II. The y axis illustrates normalized, log transformed, and scaled peak area. Horizontal lines within the boxes represent the group means. Open circles represent excluded levels (outliers) (n=6 mice per group).

