Figure 3. Metabolic modes of C. elegans reproductive and dauer larvae.
(A–C) Radioactively labeled metabolites of daf-2 L3, as well as non-preconditioned (NP) and preconditioned (P) dauer larvae. Enumerated spots indicate trehalose (1), glucose (2), glutamate (3) and glutamine (4). (D–F) The same analysis for daf-2;icl-1. Equivalent metabolome extracts were separated and exposed for 2 days for both strains and larval/experimental conditions. (G) Steady state trehalose levels before and after preconditioning in daf-2 and daf-2;icl-1 dauer larvae (n = 3 for each group). Both strains elevate their trehalose levels upon preconditioning (ANOVA for preconditioning reports F1,8 = 85.20, p < 0.001) but to different extents (ANOVA for strain reports F1,8 = 30.11, p < 0.001; interaction between strain and preconditioning F1,8 = 11.26, p = 0.010). Error bars show standard error of the mean. *p < 0.001. (H) Induction of non-labeled and 14C-labeled trehalose upon preconditioning in daf-2 and daf-2;icl-1 dauer larvae expressed as fold changes (n = 3 for each group). ANOVA shows that daf-2 larvae induce both non-labeled and labeled trehalose more than daf-2;icl-1 larvae (F1,8 = 26.229, p < 0.001) however induction in labeled trehalose does not differ from non-labeled (F1,8 = 0.343, p = 0.571). Error bars show standard error of the mean.

Figure 3—figure supplement 1. Details for the detection of metabolites.

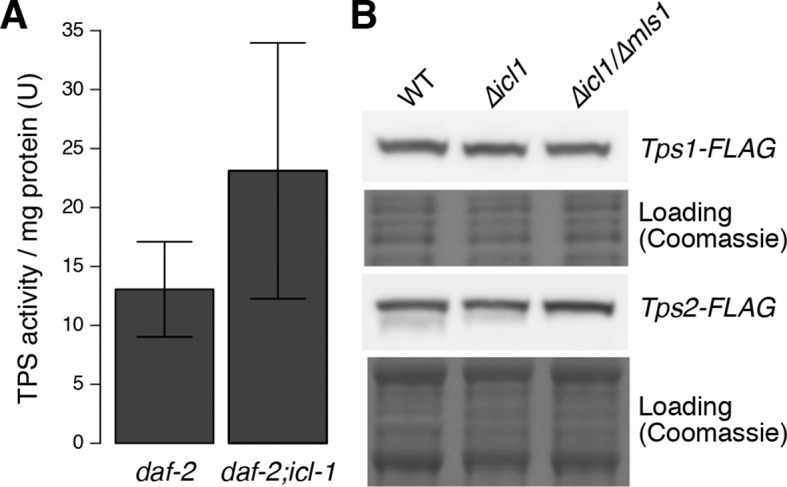
Figure 3—figure supplement 2. Trehalose 6-phosphate synthase (TPS) levels in worm and yeast.