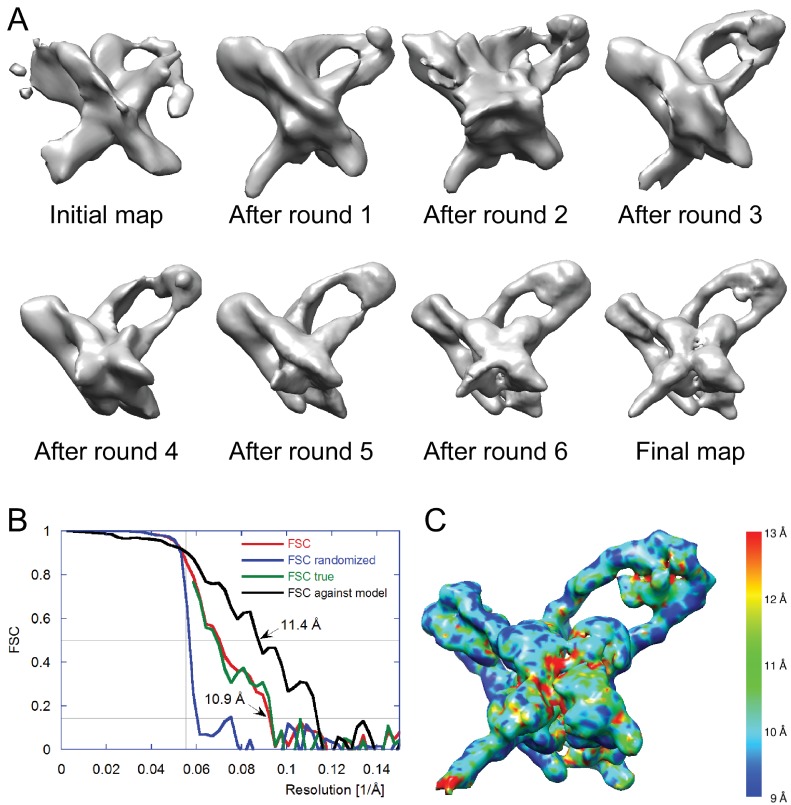
Figure 4. Electron cryo-microscopy refinement and 3D classification.
(A) Different stages of refinement and classification using FREALIGN (Lyumkis et al., 2013). Reconstructions at each stage are shown. The initial map was generated from 2D class averages (Figure 3C) using EMAN2’s initial model procedure (Tang et al., 2007). Subsequent maps resulted from several rounds of refinement and 3D classification in FREALIGN. The best-scoring reconstruction from each round was used to initialize the next round. The final reconstruction contained 10,956 particles. (B) Resolution estimation of the final reconstruction using the Fourier Shell Correlation (FSC) method. The red curve (labeled FSC) was calculated using the two reconstructions obtained from half the data each and masked using a tight mask that left a margin around the reconstructed density of about 15 Å. The blue curve (FSC randomized) was calculated using a second set of reconstructions obtained from data phase-randomized beyond a resolution of 18 Å. This curve was used to correct the first curve for any masking effects (Chen et al., 2013), yielding the final green curve (FSC true). The black curve (FSC against model) was calculated between the final map and a map derived from the atomic model presented in this study. The vertical line indicates 18 Å resolution, the limit beyond which no data was used for refinement and classification. The horizontal lines indicate values of 0.143, the FSC threshold used to assess the resolution of the map (Rosenthal and Henderson, 2003), and 0.5, the corresponding FSC threshold when comparing an experimental map against a noise-free model. Both ‘FSC true’ and ‘FSC against model’ suggest a resolution of about 11 Å. The FSC data are shown in Figure 4—source data 1 and 2. (C) Local resolution map calculated using ResMap (Kucukelbir et al., 2014). The resolution is fairly uniformly indicated as 11 Å, except for small regions within the Int tetramer and at one of the IHF heterodimer sites, indicating lower resolution and higher structural variability in these regions.
DOI: http://dx.doi.org/10.7554/eLife.14313.006

