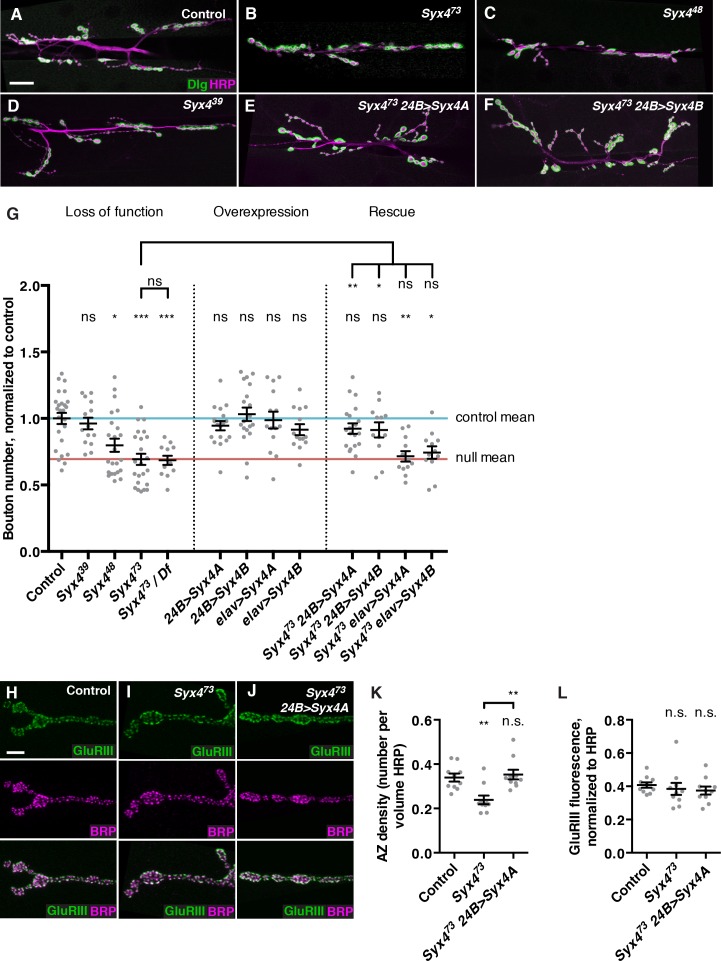
Figure 3. Syntaxin 4 regulates synaptic growth at the NMJ.
(A–F) Representative images of NMJs stained with antibodies to the postsynaptic marker Dlg (green) and the neuronal membrane marker HRP (magenta) to highlight the number of synaptic boutons; images are shown from precise excision control (A), Syx473 (B), Syx448 (C), Syx439 (D), Syx473 24B>Syx4A (E), and Syx473 24B>Syx4B (F) animals. (G) Quantification of bouton number, normalized to controls. Blue line indicates the control mean. Red line indicates Syx473 null mean. Data are presented as mean ± SEM. (H–J), Representative images of NMJs stained with antibodies to GluRIII (green) and the AZ marker Brp (magenta); images are shown from precise excision control (H), Syx473 (I), and Syx473 24B>Syx4A (J) animals. (K), Quantification of AZ density, calculated as the number of AZs per volume HRP. Data are presented as mean ± SEM. (L) Quantification of GluRIII fluorescence per HRP fluorescence. Data are presented as mean ± SEM. Scale bars = 20 μm (A–F), 5 μm (H–J). Statistical comparisons are fully described in Figure 3—source data 1, and are indicated here as ***p<0.001, **p<0.01, *p<0.05, ns = not significant; comparisons are with control unless indicated.
DOI: http://dx.doi.org/10.7554/eLife.13881.009

