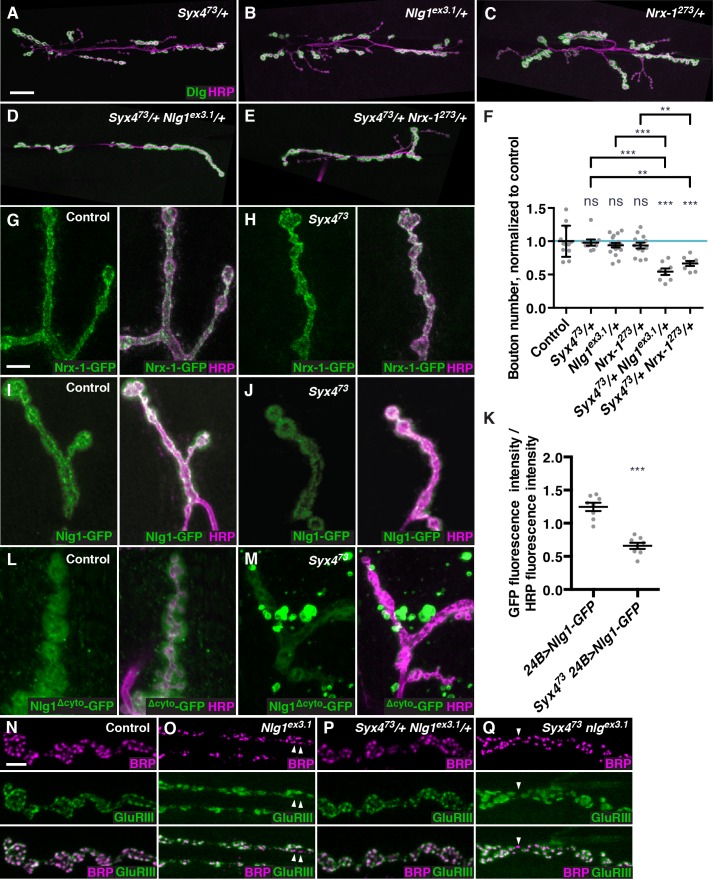
Figure 5. Syntaxin 4 interacts with Neuroligin 1 and regulates its membrane localization.
(A–E), Representative images of NMJs stained with antibodies to the postsynaptic density marker Dlg (green) and the neuronal membrane marker HRP (magenta) to highlight the number of synaptic boutons; images are shown from Syx473/+ (A), Nlg1ex3.1/+ (B), Nrx-1273/+ (C), Syx473/+ Nlg1ex3.1/+ (D), and Syx473/+ Nrx-1273/+ (E) animals. (F) Quantification of bouton number, normalized to controls. Blue line indicates the control mean. Data are presented as mean ± SEM. (G–H), Representative images of NMJs stained with antibodies against HRP (magenta) and expressing Nrx-1-GFP in a control (G) or Syx473 mutant (H) background. (I–J) Representative images of NMJs stained with antibodies against HRP (magenta) and expressing Nlg1-GFP in a control (I) or Syx473 mutant (J) background. (K) Quantification of GFP fluorescence per HRP fluorescence from animals expressing Nlg1-GFP in a control or Syx473 mutant background. Data are presented as mean ± SEM. (L–M) Representative images of NMJs stained with antibodies against HRP (magenta) and expressing Nlg1Δcyto-GFP in a control (L) or Syx473 mutant (M) background. (N–Q) Representative images of NMJs stained with antibodies against Brp (magenta) and GluRIII (green), from precise excision control (N), Nlg1ex3.1 (O), Syx473/+ Nlg1ex3.1/+ (P), and Syx473 Nlg1ex3.1 (Q) animals. Arrowheads indicate AZs lacking an apposed GluR field. Scale bars = 20 μm (A–E), 5 μm (I,J,L–Q). Statistical comparisons are fully described in Figure 5—source data 1, and are indicated here as ***p<0.001, **p<0.01, *p<0.05, ns = not significant; comparisons are with control unless indicated.
DOI: http://dx.doi.org/10.7554/eLife.13881.013
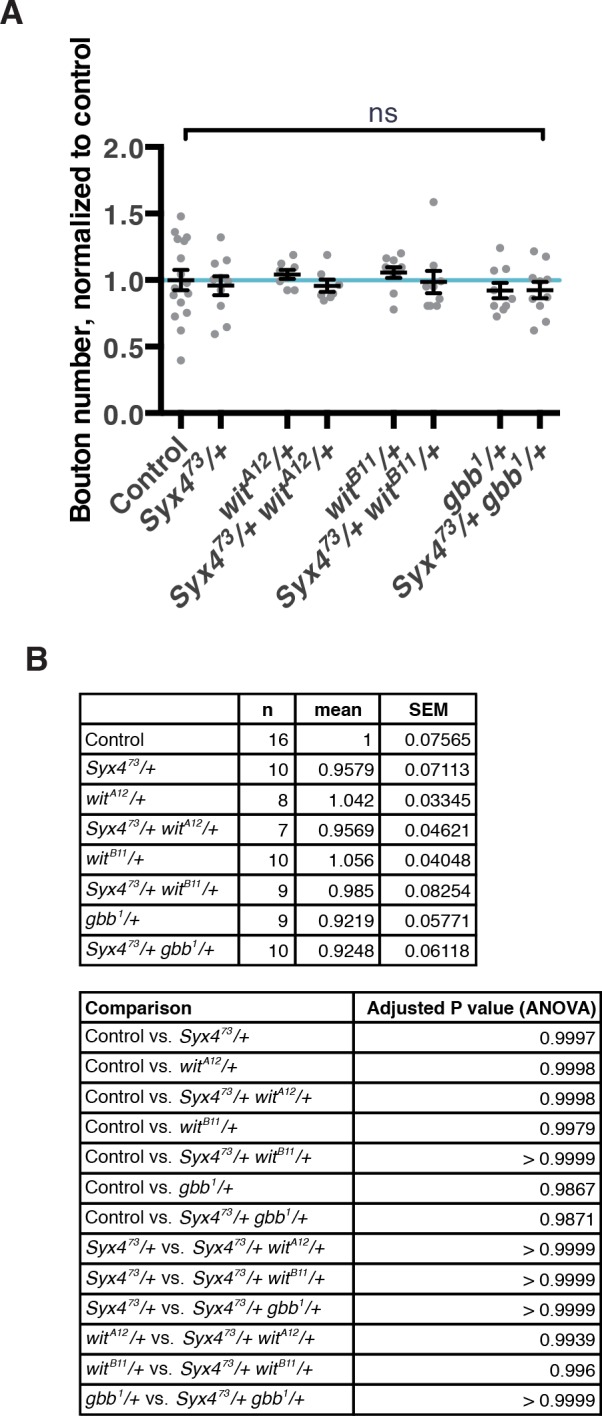
Figure 5—figure supplement 1. Genetic interaction experiments between Syx4 and BMP pathway components.

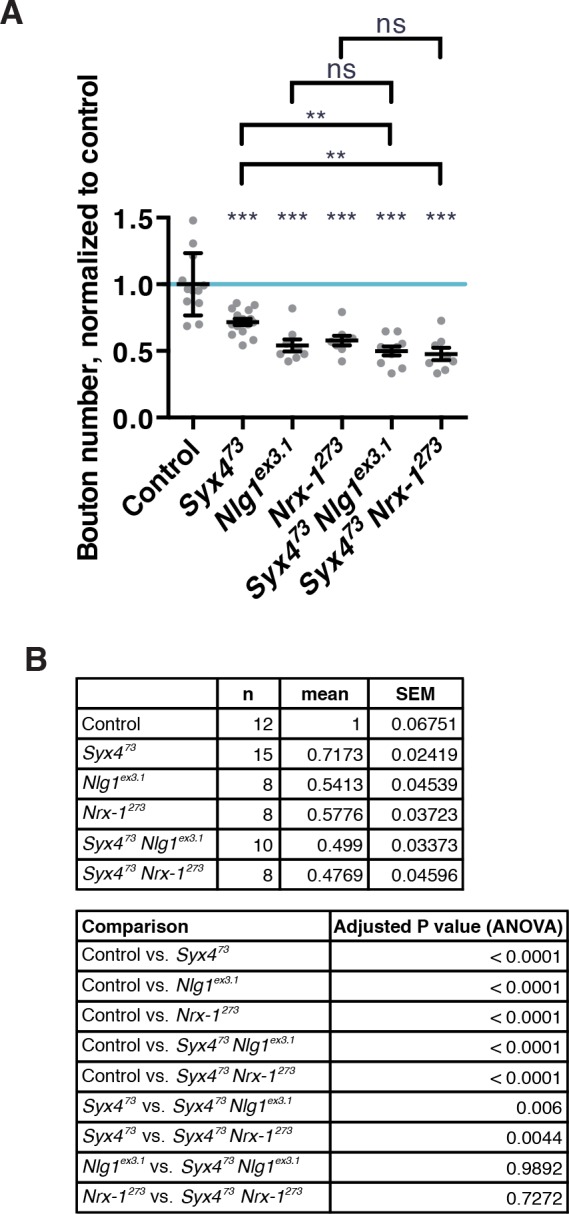
Figure 5—figure supplement 2. Genetic interaction experiments between single and double null mutants of Syx4, Nlg1, and Nrx-1.


